EUR/USD Day Trading Charts And Trades For August
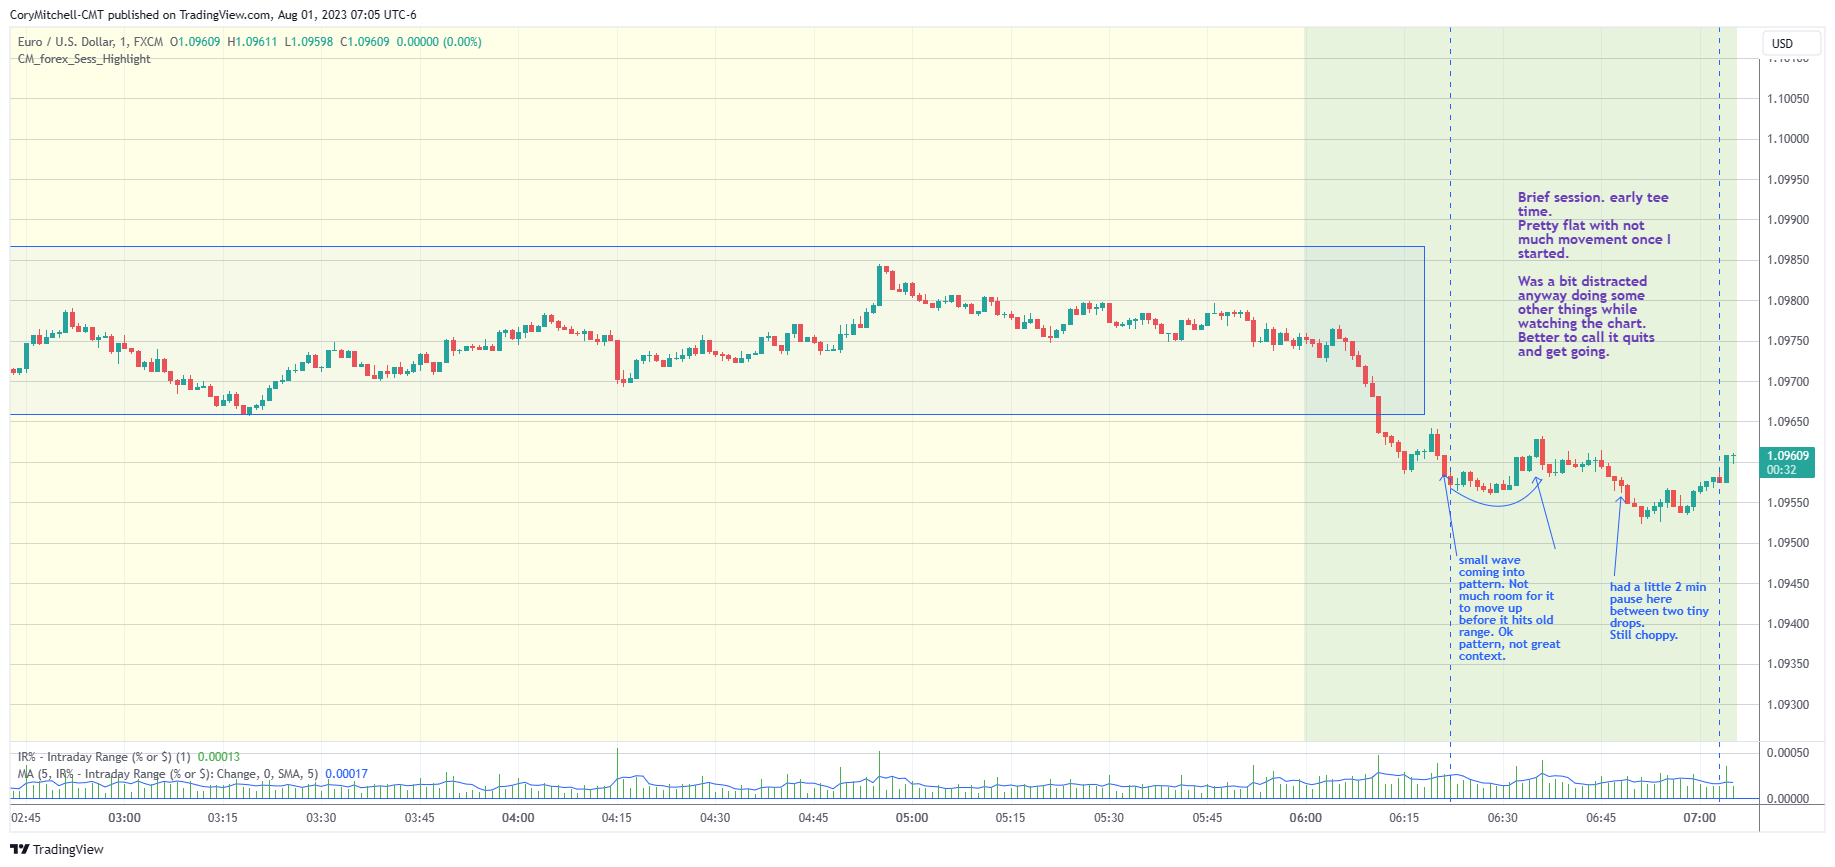
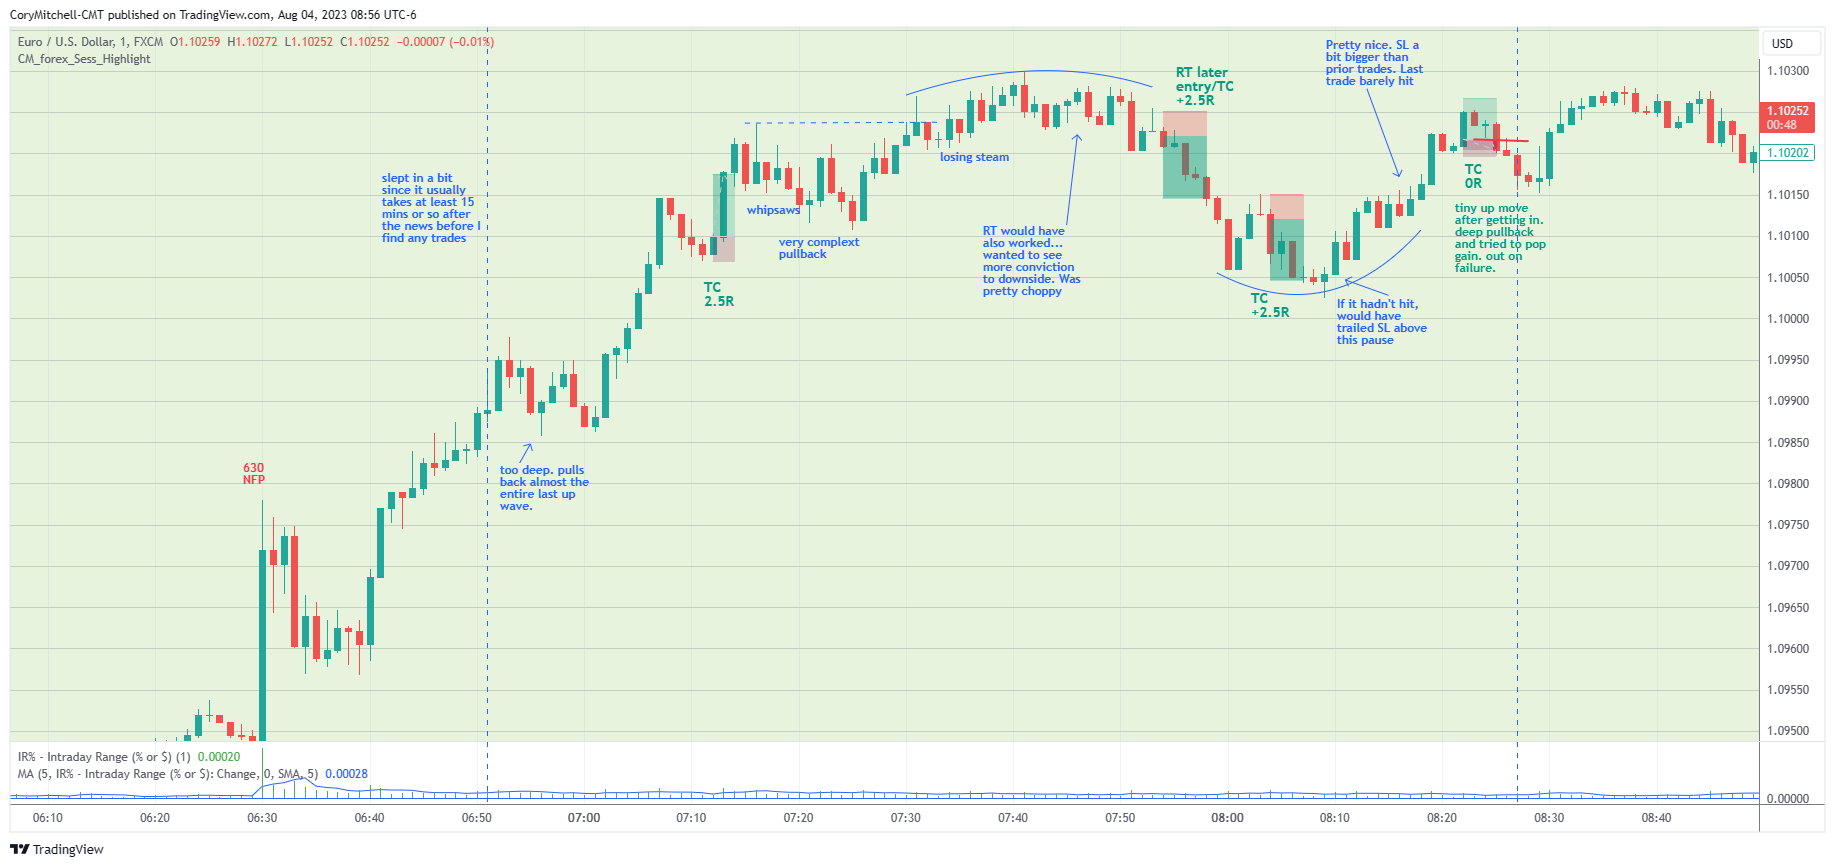
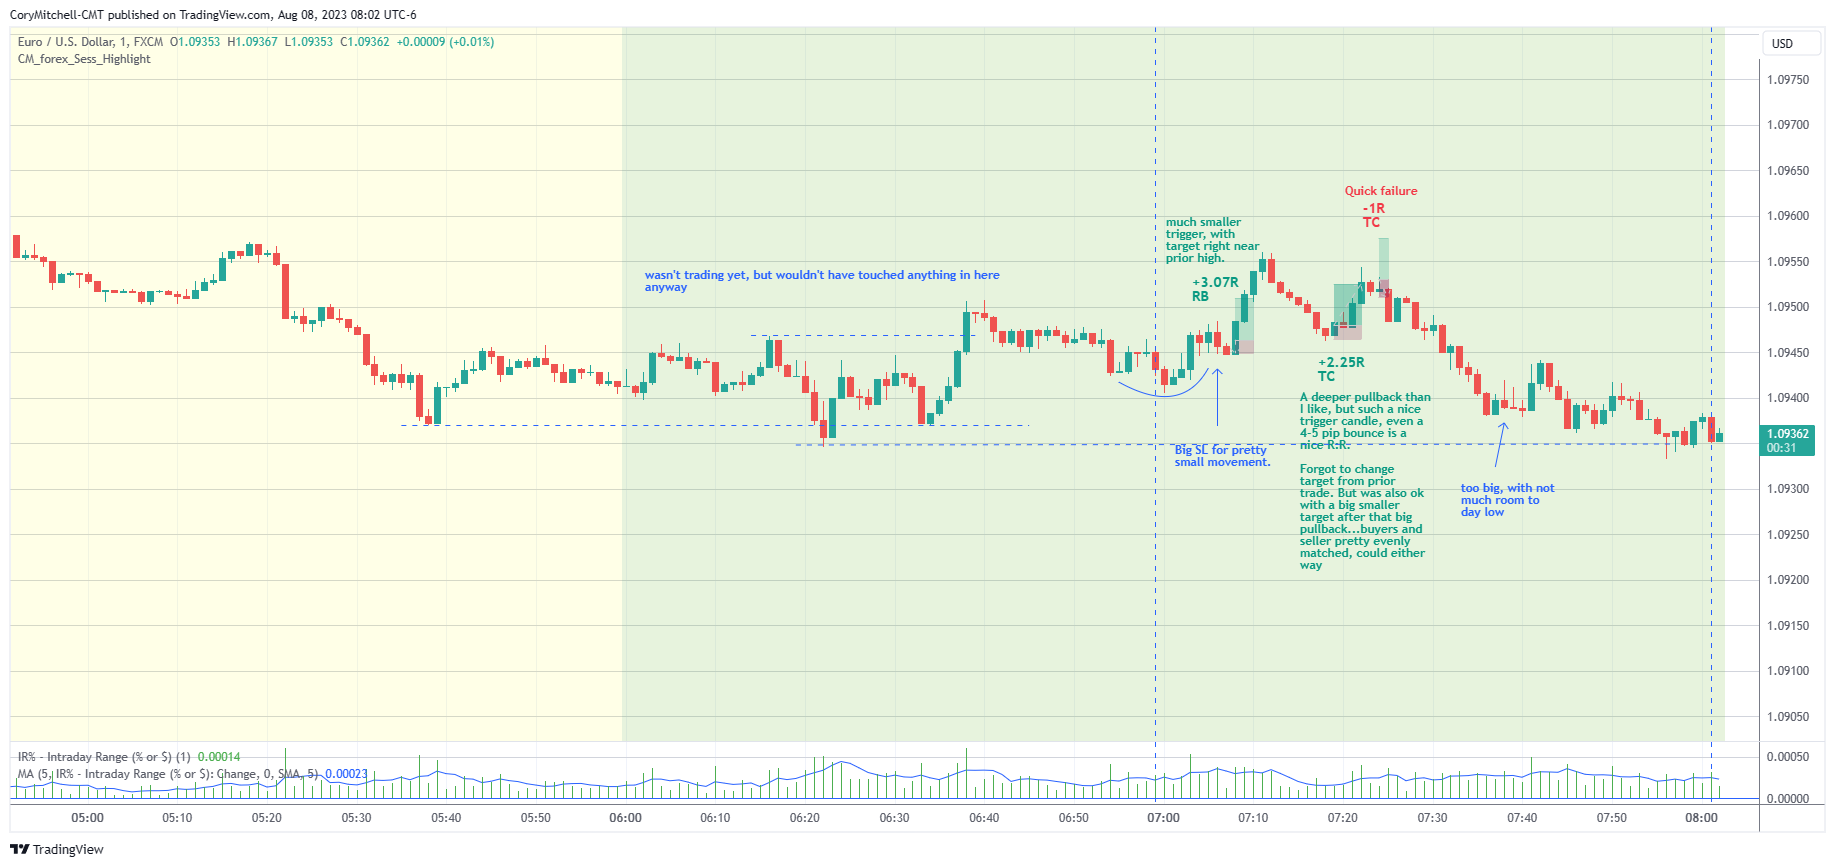
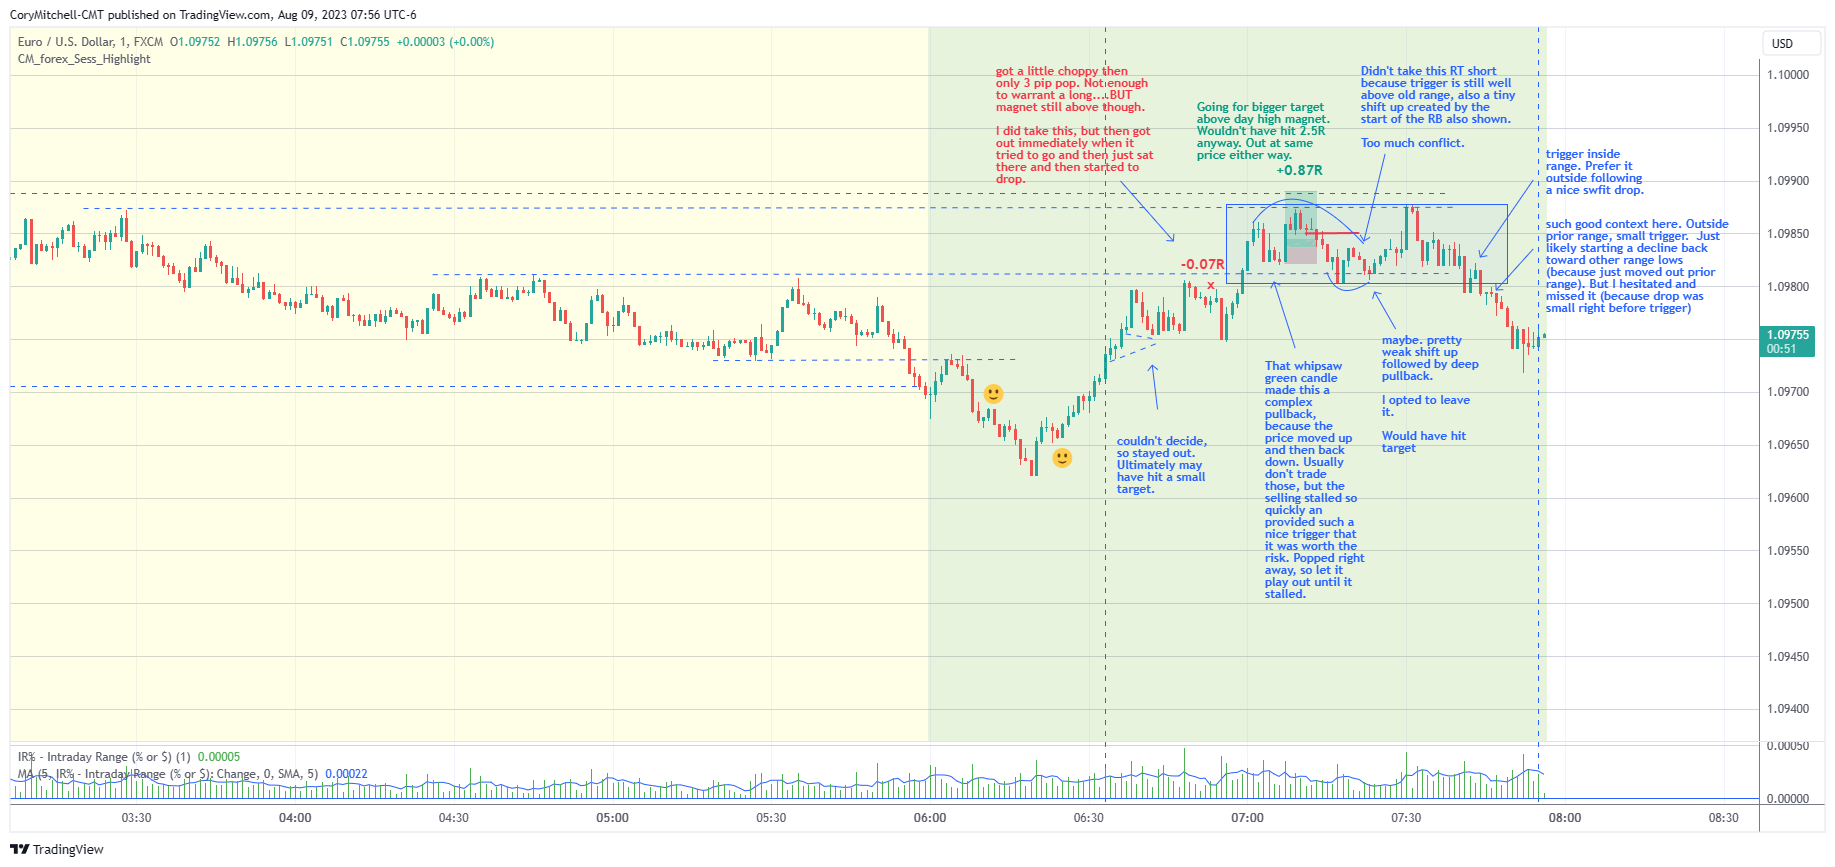
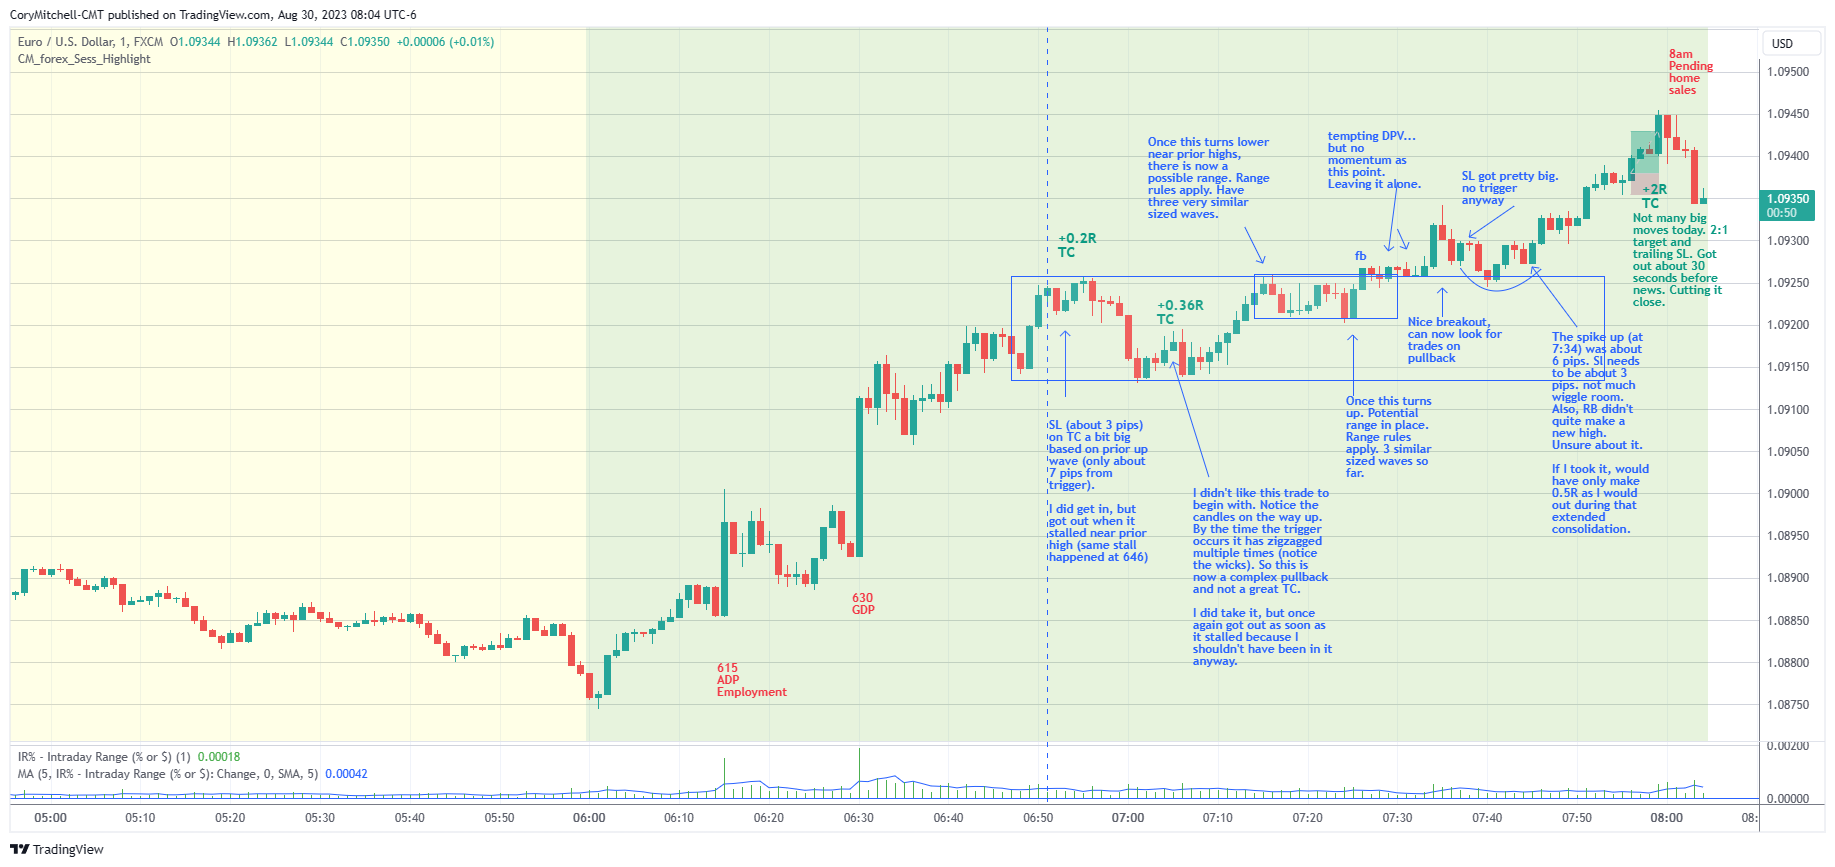
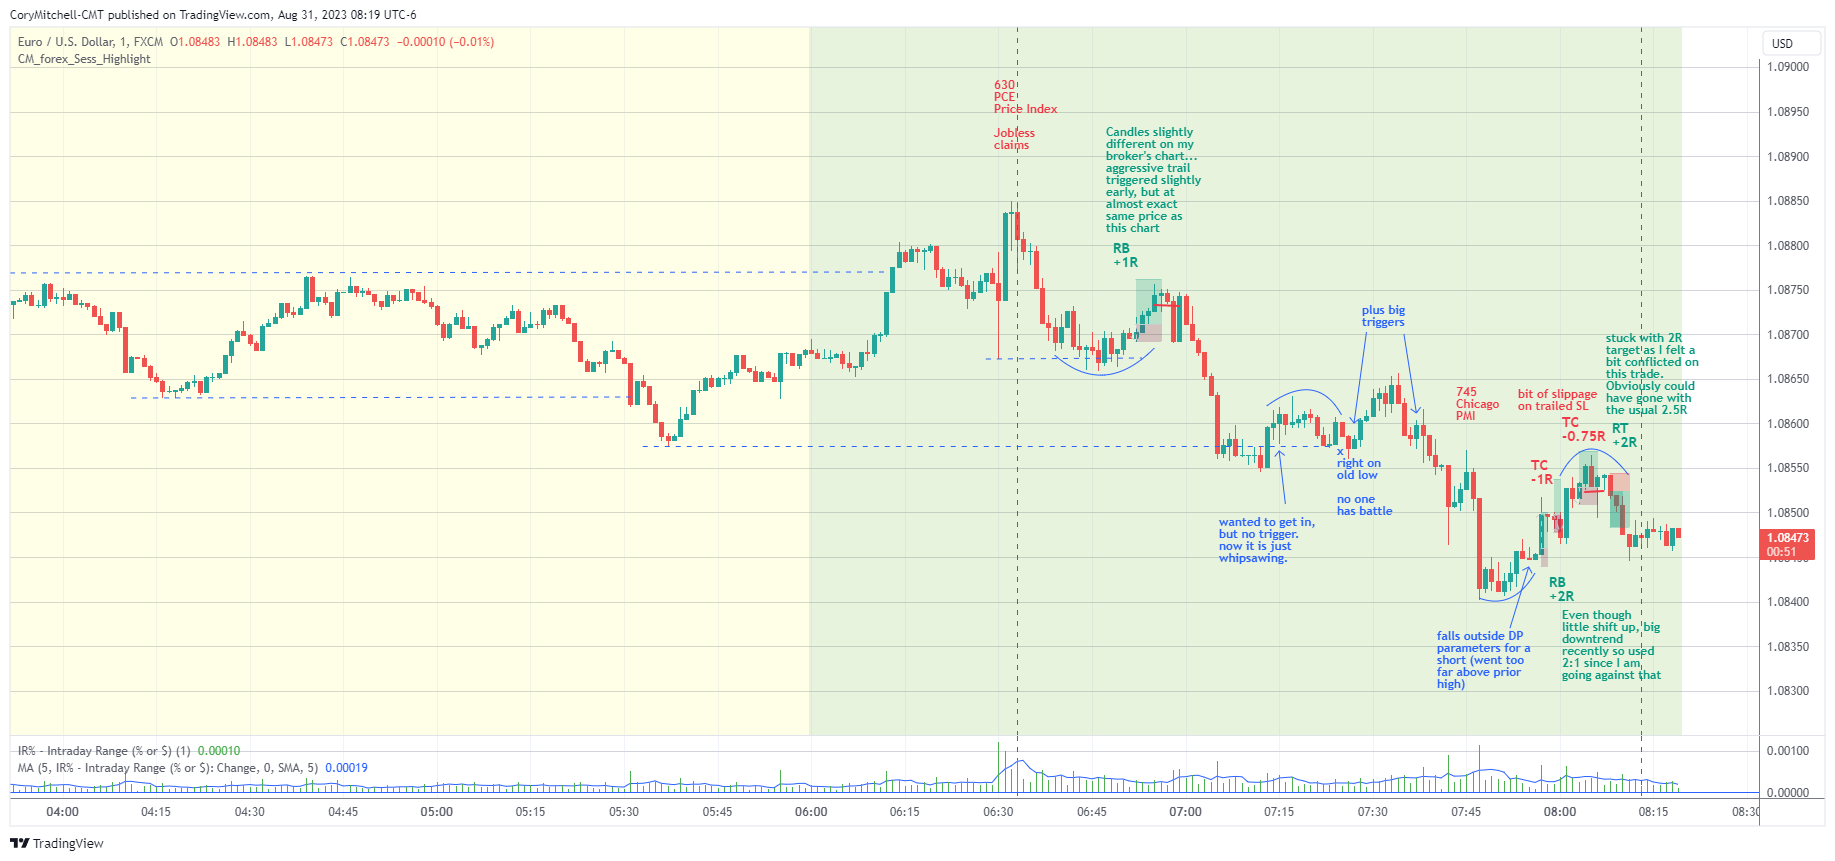
These are the day trades (along with notes and charts) I saw in August (early US session) utilizing the strategies discussed in the EURUSD Day Trading Course.
Charts are posted daily on Twitter, and every month I post a bunch of charts on this site (like this article) in the Forex Trades & Analysis section (where you can now find thousands of historic trades with charts).
Here are charts with examples of the trades over the last month. Some days are missing if I didn’t trade that day.
In each chart, there’s a reference to “R”. Such as -1R or +2.5R. I risk 1% of my account on each trade, so R for me is 1%.
-1R is -1%.
+2.5R is +2.5% on the account.
Add these up to get the total for the day.
R is a way to express risk and reward regardless of account size.
EURUSD Day Trading Charts and Trade Examples for August 2023
Click on a chart below to expand it. The dates are on the charts in the upper left-hand corner.
(Click on image to enlarge)
(Click on image to enlarge)

(Click on image to enlarge)

(Click on image to enlarge)
(Click on image to enlarge)
(Click on image to enlarge)
(Click on image to enlarge)
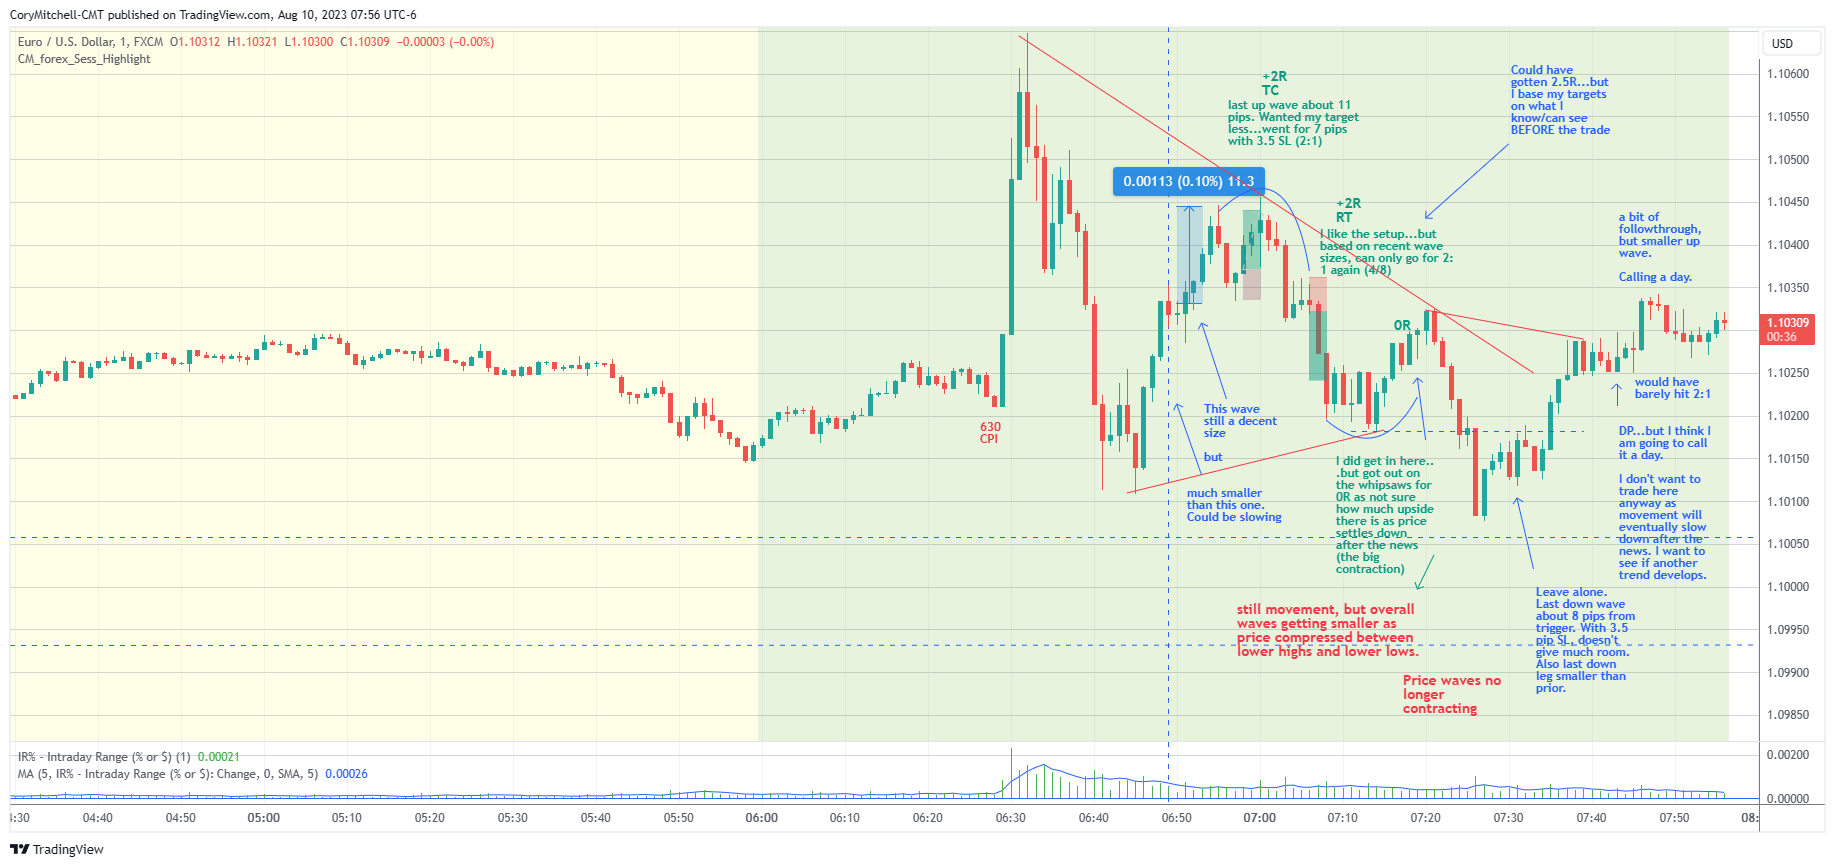
(Click on image to enlarge)

(Click on image to enlarge)

(Click on image to enlarge)
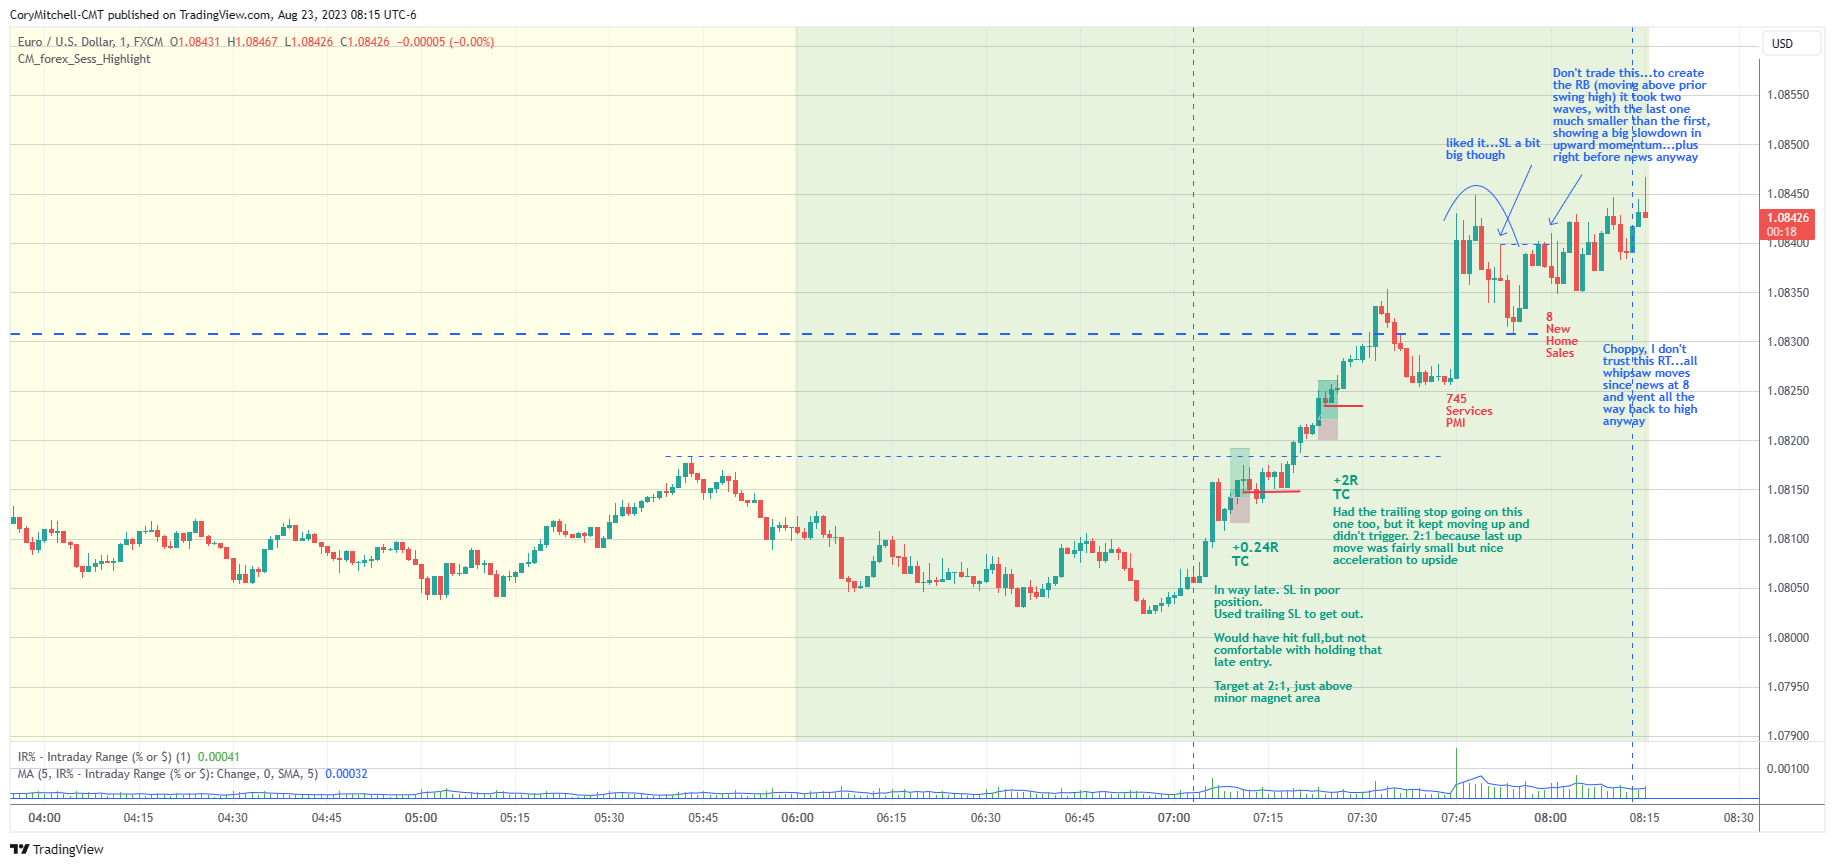
(Click on image to enlarge)
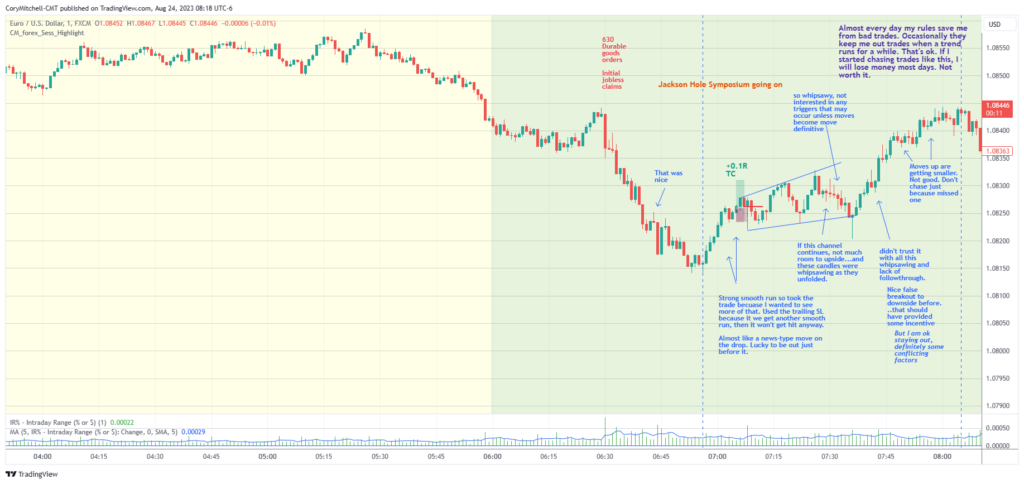
(Click on image to enlarge)
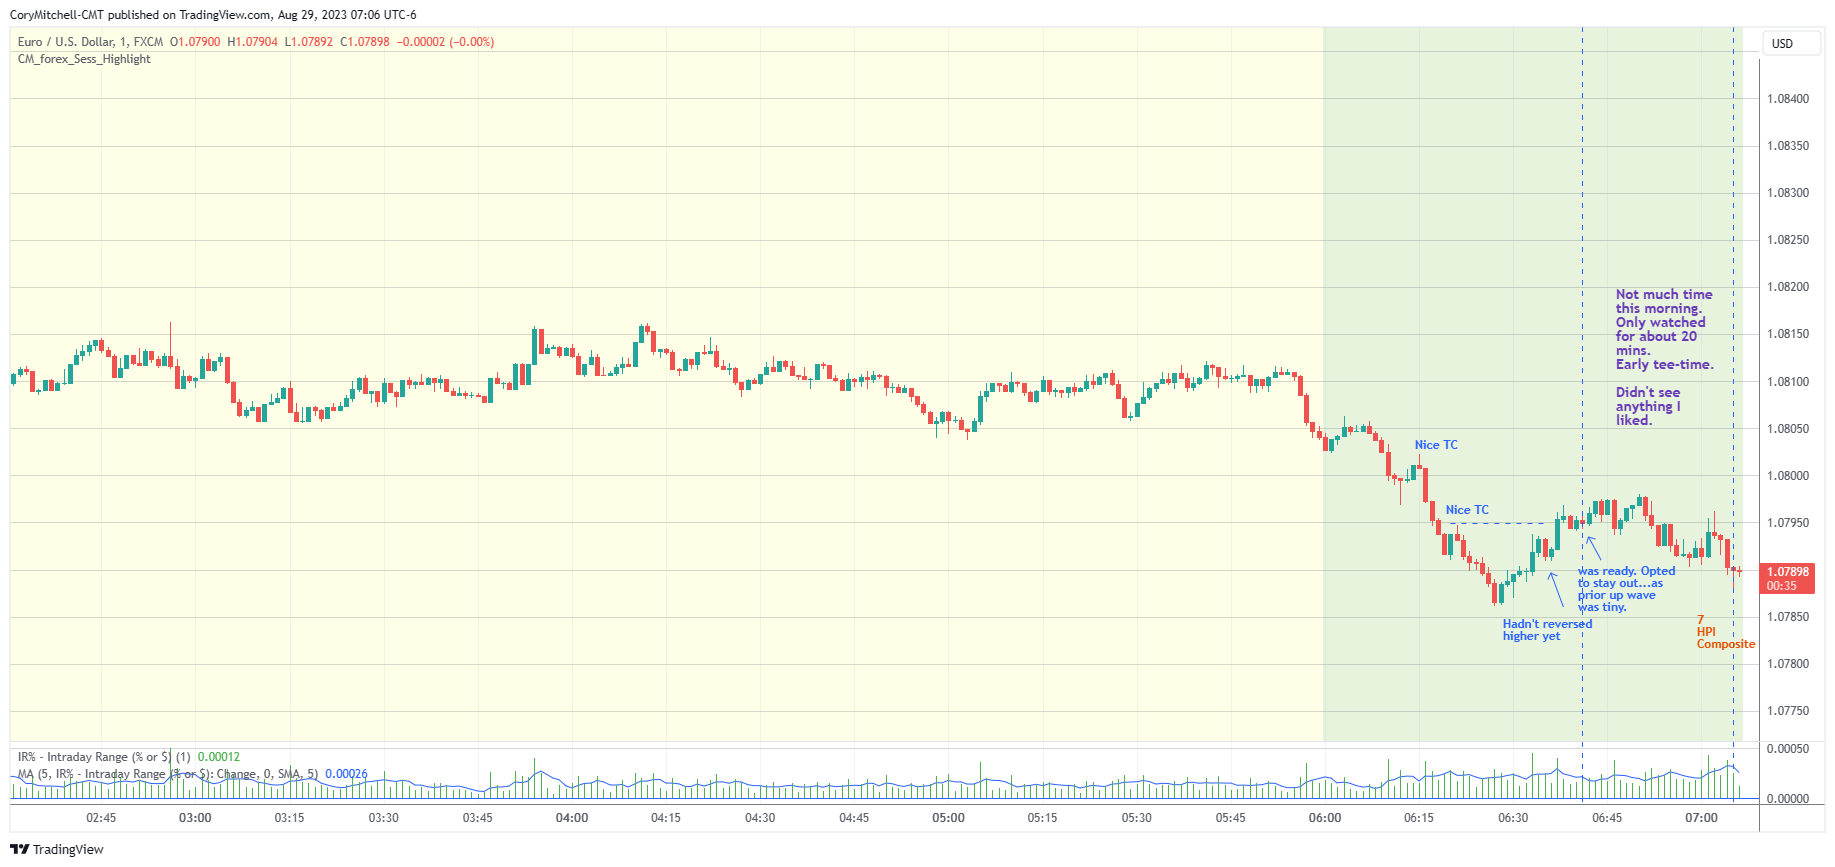
(Click on image to enlarge)
(Click on image to enlarge)
More By This Author:
Historical Average Returns For Nasdaq 100 Index
Best Performing US ETFs Of The Last 1, 3, 5, And 10 Years
AMGN Near Buy Point With Strong Fundamentals And Rising Dividend
Disclaimer: Nothing in this article is personal investment advice, or advice to buy or sell anything. Trading is risky and can result in substantial losses, even more than deposited if using ...
more


