Euro Slides And US Dollar Soars As China Face Further Restrictions. New Lows For EUR/USD?
The Euro is under pressure to start the week as demand for US Dollars picked up steam on concerns about global economic growth.
The scramble into the ‘big dollar’ was attributed to fears of further lockdowns in China. Shanghai reported its first case of the latest highly contagious variant of Covid-19, BA.5 omicron. APAC stocks are lower as a result, with the exception of Japan.
An election result over the weekend saw Japan’s Liberal Democratic Party (LDP) gain a stronger hold in the House of Councillors, the upper house of Japan’s parliament. This was interpreted as a vote of confidence in maintaining an ultra-loose monetary policy.
Consequently, the Nikkei 225 index got a boost, and Yen weakened, with USD/JPY printing a fresh 24-year high above 137.00. 10-year Japanese Government bond (JGB) yields remain anchored near 0.25%.
The commodity and growth linked AUD, CAD, NOK, and NZD all weakened to start the week. US equity futures are pointing toward a negative start for the Wall Street cash session on Monday.
Iron ore and copper are lower again while gold remains steady near US$ 1,742 an ounce. Crude oil slipped, with the WTI futures contract under US$ 104 bbl and the Brent contract around US$ 106.50 bbl.
It is a slow start to the week data-wise, but there are a number of key events listed below that are coming up in the days ahead.
|
EVENT |
DATE, TIME (GMT) |
|
Eurozone Economic Sentiment |
Tues, 09:00 |
|
US Consumer Inflation Expectations |
Tues, 15:00 |
|
RBNZ Rate decision |
Wed, 02:00 |
|
US CPI |
Wed, 12:30 |
|
BOC Rate Decision |
Wed, 14:00 |
|
Earnings – JPM, MS, TSM |
Thur, 11:30 |
|
China GDP |
Fri, 02:00 |
|
UofM Confidence |
Fri, 14:00 |
The full economic calendar can be viewed here.
EURUSD Technical Analysis
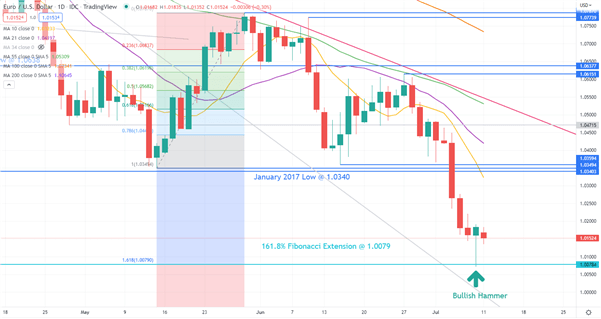
The Euro bounced off the 161.8% Fibonacci Extension at 1.0079 to end last week. That level might provide support if it is tested again. That is a 20-year low for EUR/USD.
Friday also saw a Bullish Hammer emerge after the dip created a new low before rallying and closing above the open. Note that the wick is more than twice the length of the candle body.
On the topside, resistance might be offered at the 1.0340 – 1.0360 area where a number of breakpoints lie.
(Click on image to enlarge)

More By This Author:
Stock Market Week Ahead: S&P 500 & DAX 40 ForecastEUR/USD Fundamental Forecast: Parity In Reach As Headwinds Accrue
US Dollar Forecast: June US Inflation Data Could Reinforce DXY’s Bullish Momentum
Disclosure: See the full disclosure for DailyFX here.


