
- EUR/USD has continued to pull back after an intra-day reversal showed up last Tuesday.
- EUR/JPY continues to work with consolidation and Euro weakness has been a noticeable item when compared to USD/JPY and GBP/JPY. EUR/GBP has shown a decisive trend over the past few days but remains within a longer-term area of congestion. A key spot of support is getting closer, however.
- The analysis contained in the article relies on price action and chart formations. To learn more about price action or chart patterns, check out our DailyFX Education section.
Has EUR/USD topped? I asked that question last Thursday and since then there’s been a continued build of evidence that this may be the case. This week opened with a push below a key area of support with EUR/USD setting a fresh weekly low, which happened as price was breaking below the 1.0282 Fibonacci level that had twice helped to set support last week.
EUR/USD tested through 1.0250 but didn’t quite make it down to the next area of support at 1.0197 before finding a bounce, and that bounce has since pushed right back into possible resistance at that prior spot of Fibonacci support.
EUR/USD Four-Hour Chart
(Click on image to enlarge)
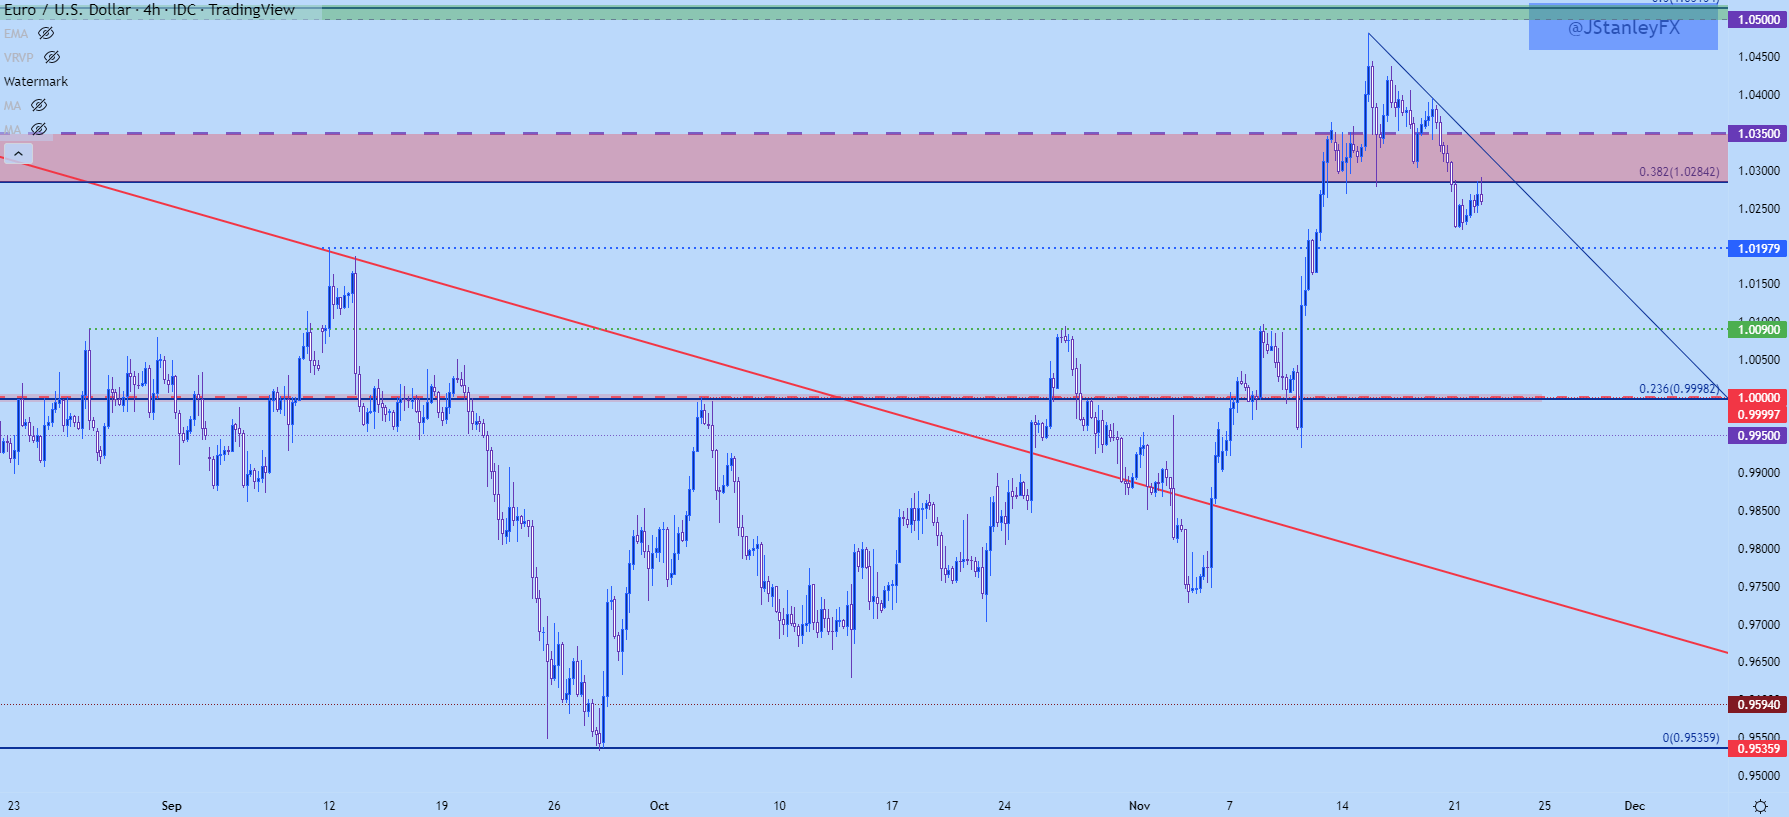
Chart prepared by James Stanley; EURUSD on Tradingview
As I had looked at in this week’s tech forecast for the USD, there was a symmetrical triangle in EUR/USD which, in and of itself doesn’t carry a directional bias. If meshed up with the prior move, however, an argument could be made for a bull pennant – but for that to remain alive buyers would need to defend support from the formation’s lower trendline – and that did not happen as prices broke down to start this week.
This can keep the focus on bearish scenarios until either resistance is broken or a more solid area of support comes into play. Sitting below the current price action is the 1.0175-1.0197 zone, and below that is the 1.0090 level that set the October monthly high.
If sellers can even take out that area, we’re back in the parity box which I’m stretching down to the .9900 handle. If this comes into play before the end of the year it’ll be a massive test for Euro bears.
EUR/USD Daily Chart
(Click on image to enlarge)
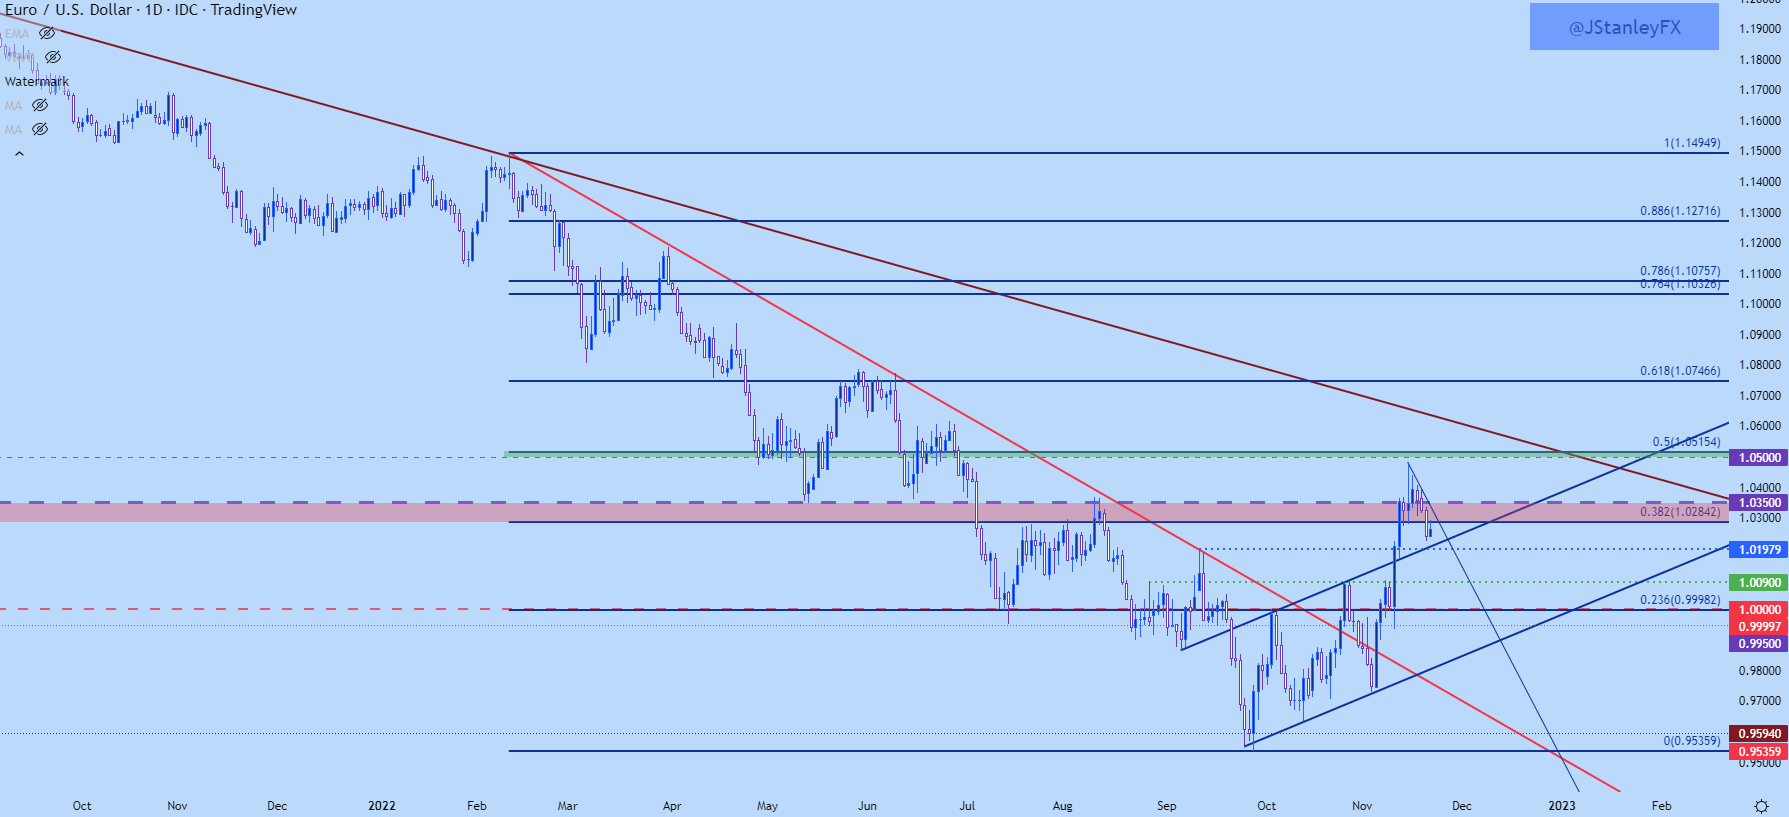
Chart prepared by James Stanley; EURUSD on Tradingview
EUR/USD Big Picture
This is worthy of inclusion given its importance on the shorter-term matter but, from the weekly chart of EUR/USD, we can see where the pair put in a strong reaction at a key spot last week of 1.0350. The pullback that we’ve seen thus far may be a reignition of the bearish longer-term trend after a quick respite. But – it may also be the pair working on a longer-term bottom and all that we’d need to further feed that argument is some element of higher-low support taking hold ahead of the parity level again, and this is why that 100 pip zone from .9900-1.0000 is so important right now.
EUR/USD Weekly Chart
(Click on image to enlarge)
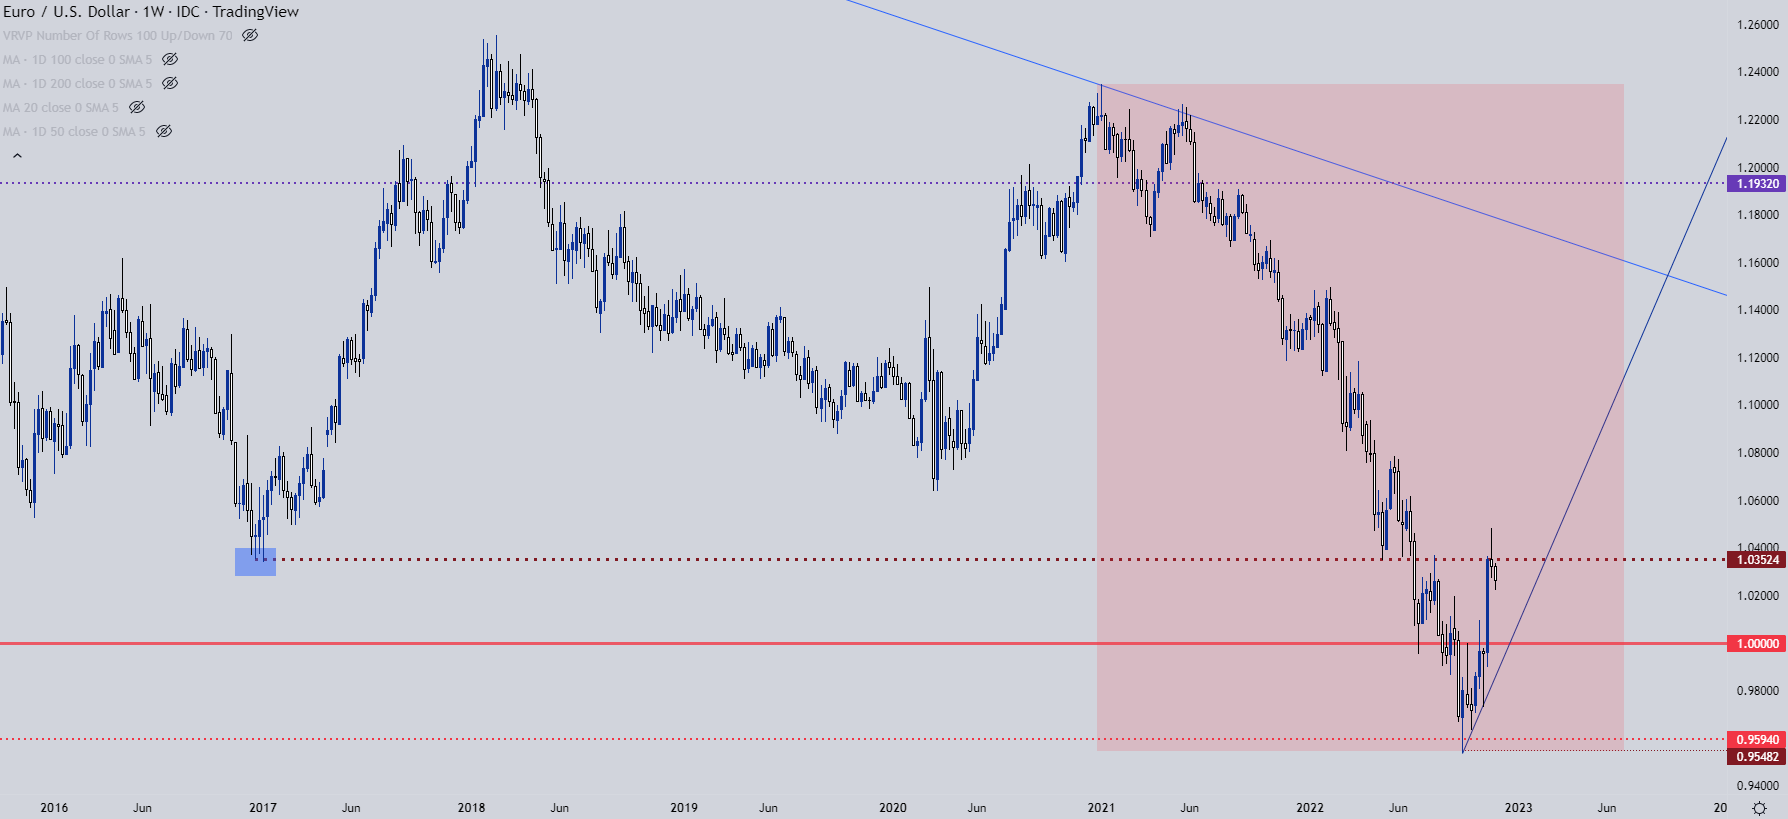
Chart prepared by James Stanley; EURUSD on Tradingview
EUR/JPY
I looked into EUR/JPY yesterday and the contrast between USD/JPY and GBP/JPY versus EUR/JPY was noticeable. While USD/JPY and GBP/JPY had already started short-term bullish breakouts, EUR/JPY was holding below a key spot of resistance, plotted at 145.52-145.64. This zone came into play again yesterday and it similarly produced a turn in the pair, although that turn hasn’t yet led to a lower low in EUR/JPY.
EUR/JPY Four-Hour Chart
(Click on image to enlarge)
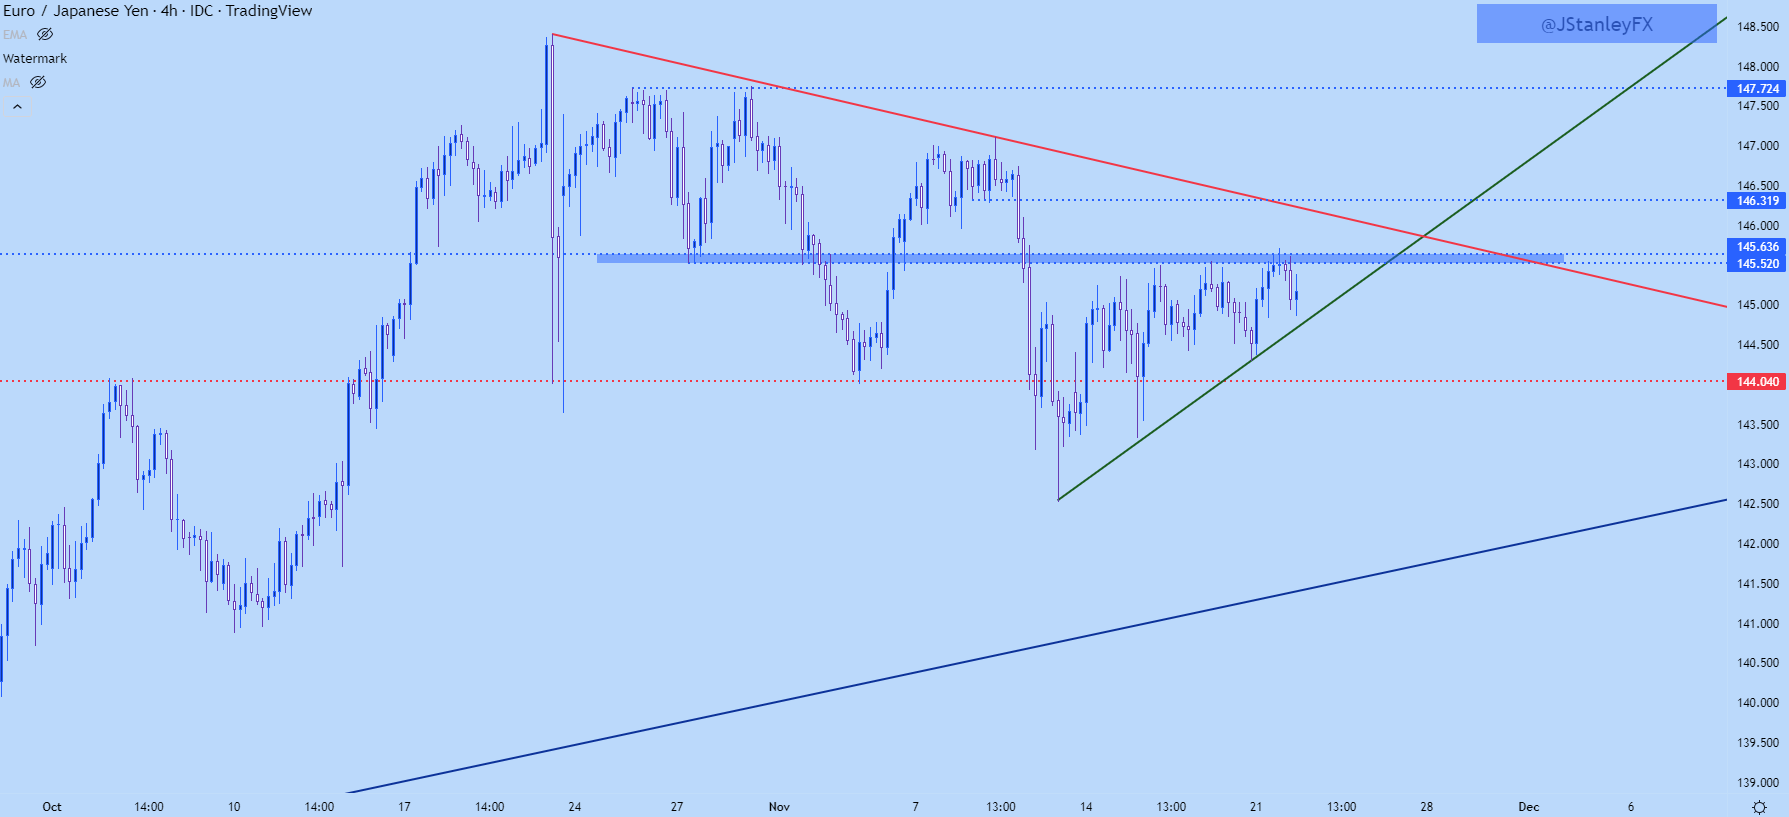
Chart prepared by James Stanley; EUR/JPY on Tradingview
EUR/JPY Triangle Or Wedge?
Triangles and wedges may look similar and I’ll even see the two formations often get mixed up by technical analysts, but the way that they are approached is very different. And sometimes, both formations can be justified and this makes proper identification near-impossible until it’s too late.
There’s a similar setup in EUR/JPY at the moment. There’s the horizontal resistance that’s remained in play around 145.62-145.64 and that’s helped to hold the highs. There’s also a clear bullish trendline at support, helping to demarcate the lows.
So, if we take just that, there’s an ascending triangle – and that formation is often approached with the aim of bullish breakouts.
However – there’s been a build of slightly higher highs leading into and existing around the test of that resistance, so a resistance trendline can be drawn atop price action and this too could be justified. But, at that point, we now have a rising wedge – which is approached in the exact opposite manner of the ascending triangle above, instead with traders looking for bearish breakdowns in the pair.
So, what is a trader to do when the formation is unclear?
One option is to wait…
Because if that initial breakout is going to lead to a trend, the trader doesn’t have to capture the very first move – they can allow the break to happen after which they look to trade the fresh trend after the break. And given the context, there are usually some nearby levels to use for such a purpose.
In the case of EUR/JPY, traders can wait for either a bearish or bullish break, and when that pulls back, can look to find higher-low support at prior resistance or lower-high resistance at prior support. And traders can incorporate other levels, too, such as I highlighted yesterday with the 144 level in EUR/JPY. So, bears can look to a breach of that level to signal bears’ willingness to extend the trend, after which they look to work the pullback off of lower-high resistance at an area such as 144.50. And on the top side, resistance is fairly well-defined, so if bulls can force a break, that becomes an area to look for higher-low support with the aim of bullish continuation.
EUR/JPY Four-Hour Price Chart
(Click on image to enlarge)
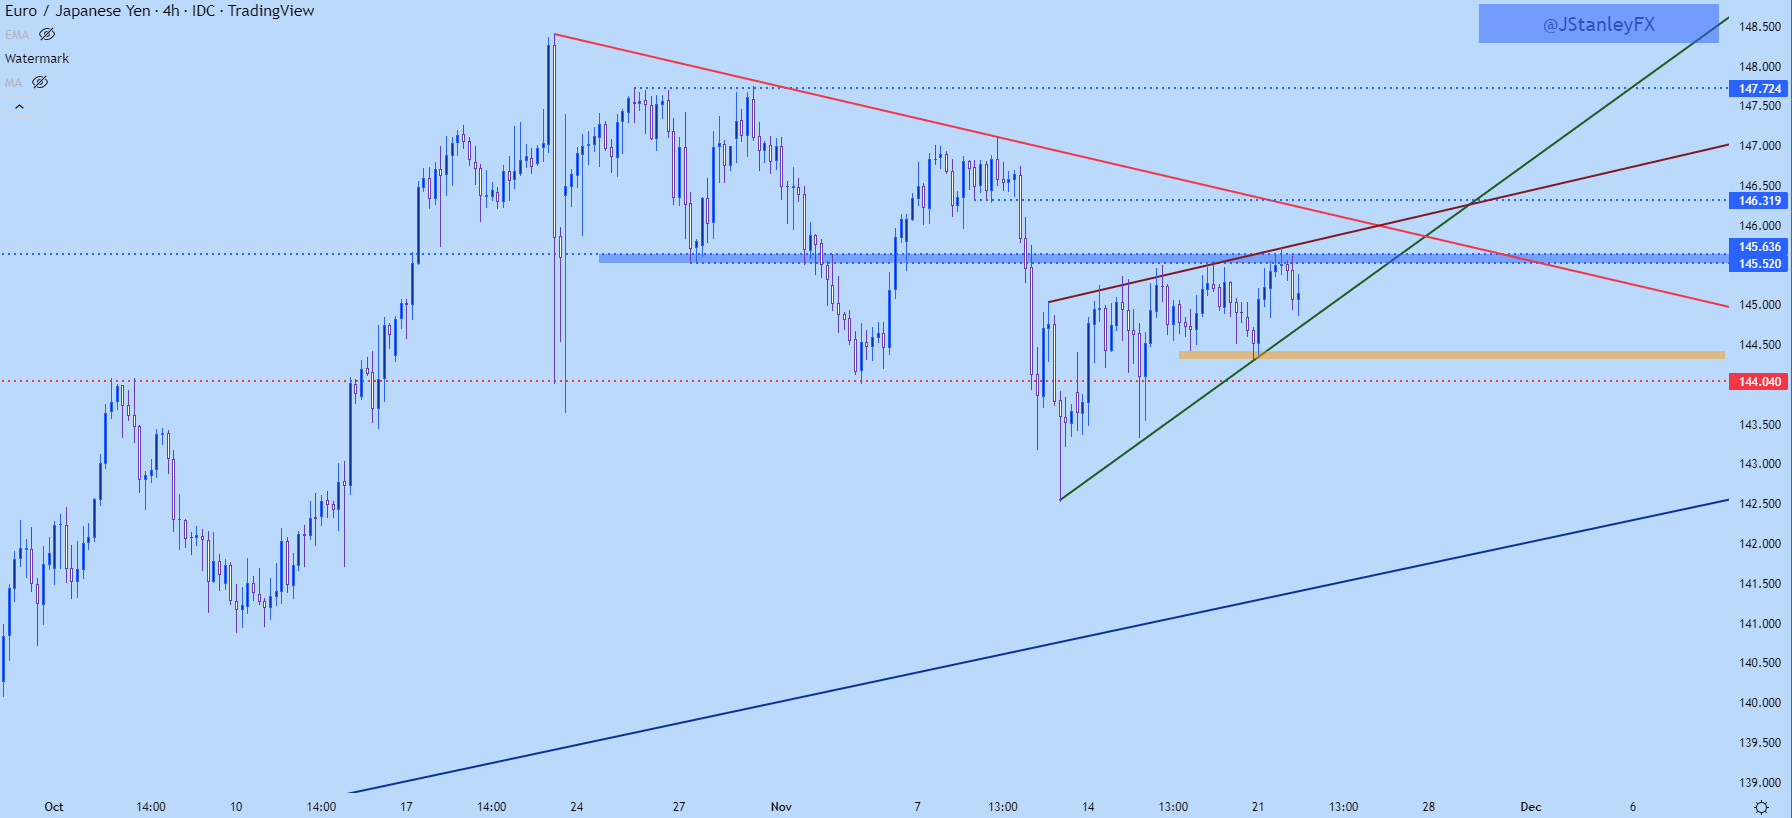
Chart prepared by James Stanley; EUR/JPY on Tradingview
EUR/GBP Moving Towards Support
EUR/GBP is working on its third consecutive bearish daily candle and that extends a move that started the week prior, as prices started pulling back from the resistance area at .8780. At current, the price is a little over 50 pips away from a really key support zone, plotted around the .8577-.8584 area on the chart. This was a swing-high in July that came back in as support in September and then twice in October.
EUR/GBP Daily Price Chart
(Click on image to enlarge)
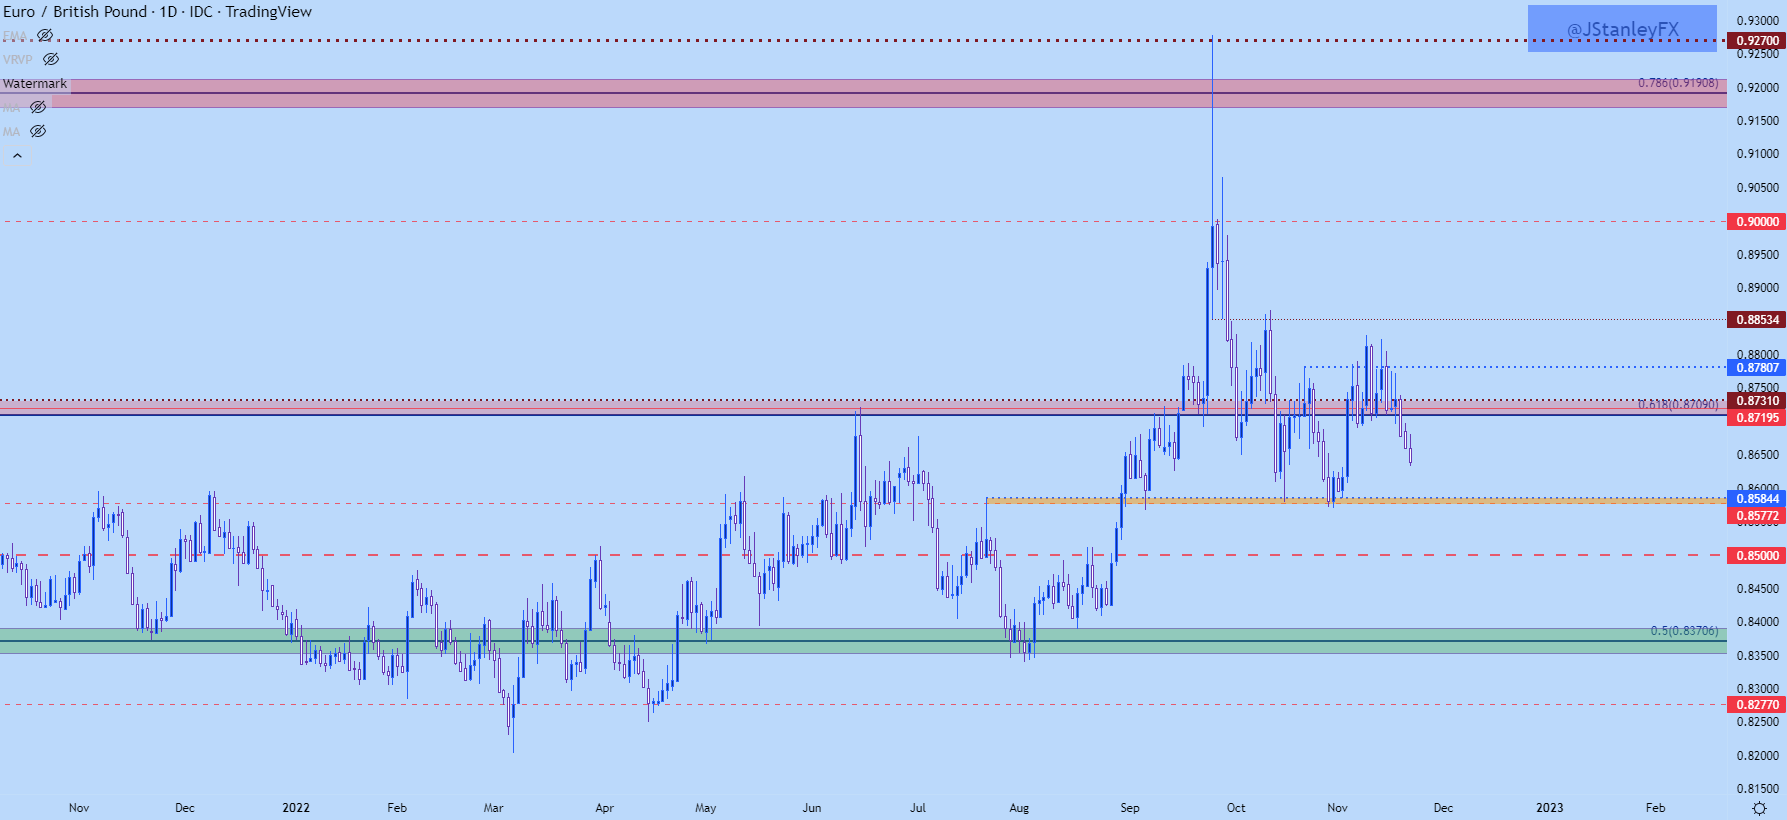
Chart prepared by James Stanley; EURGBP on Tradingview
More By This Author:
S&P 500, Nasdaq, Dow Jones Techs For This WeekGold Price Forecast: XAU/USD Breakout Pulls Back, Tests Support At Prior Resistance
Is Yen Weakness On The Way Back? USD/JPY, GBP/JPY, EUR/JPY


Comments
Log in or sign up to join the conversation.