
EUR/JPY Price Forecast: Hovers Around 172.50 After Breaking Below Nine-Day EMA
- EUR/JPY eyes rebound above the nine-day EMA at 172.63.
- Bullish bias remains stronger as the 14-day Relative Strength Index is positioned above the 50 mark.
- The primary support lies at the psychological level of 172.00.
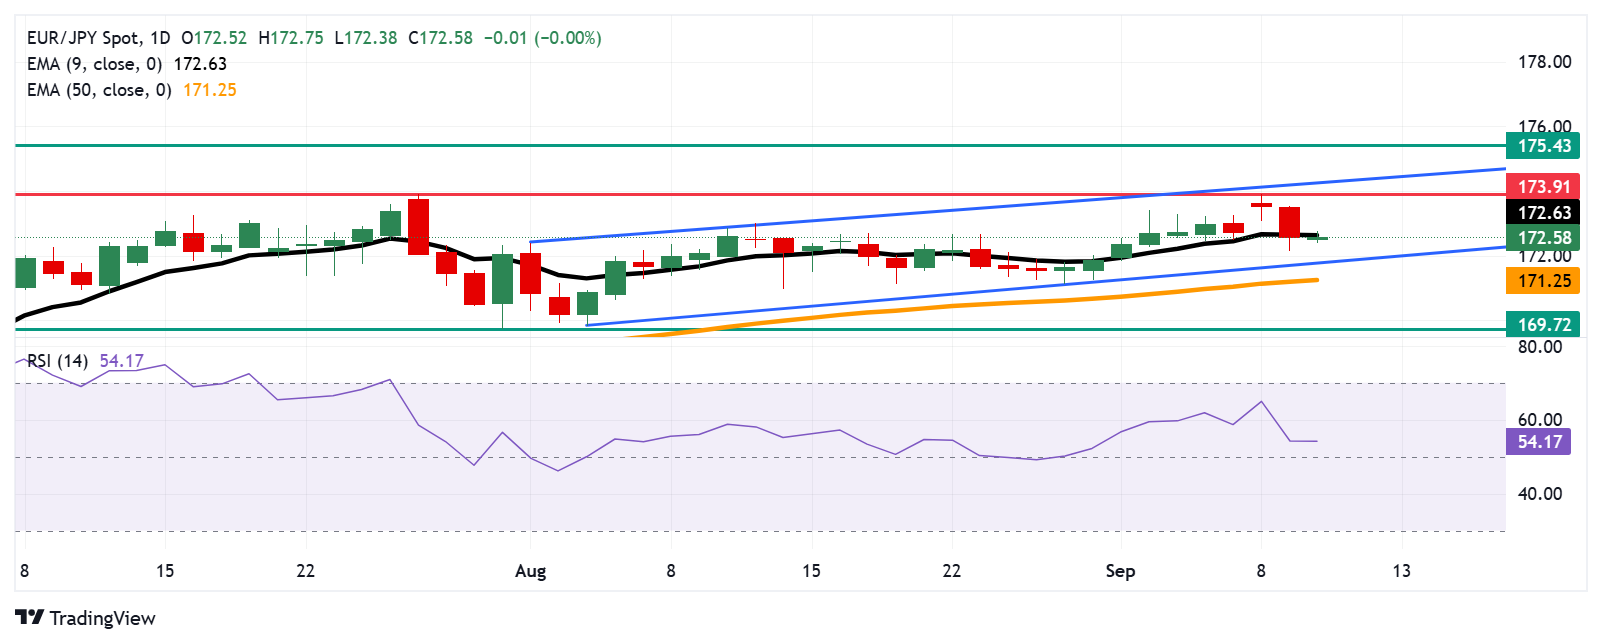
EUR/JPY holds ground after registering more than 1% losses in the previous three successive sessions, trading around 172.50 during the European hours on Wednesday. The technical analysis of the daily chart indicates a persistent bullish bias as the currency cross remains within the ascending channel pattern.
The 14-day Relative Strength Index (RSI) is positioned above the 50 mark, suggesting a bullish bias is prevailing. However, the short-term price momentum turned weaker as the EUR/JPY cross has moved below the nine-day Exponential Moving Average (EMA).
On the upside, the nine-day EMA at 172.63 is acting as the immediate barrier. A break above this level would improve the short-term price momentum and support the EUR/JPY cross to explore the region around the 173.91, the highest since July 2024, recorded on September 8, followed by the upper boundary of the ascending channel around the 174.30.
Further advances above the confluence around the ascending channel’s upper boundary would strengthen the bullish bias and lead the currency cross to approach the all-time high of 175.43, reached in July 2024.
The EUR/JPY cross may find its initial support at the psychological level of 172.00, followed by the ascending channel’s lower boundary around 171.80, followed by the 50-day EMA of 171.25. A break below this crucial support zone would weaken medium-term price momentum and push the currency cross toward the 10-week low of 169.72, last seen on July 31.
EUR/JPY: Daily Chart
(Click on image to enlarge)
Euro Price Today
The table below shows the percentage change of Euro (EUR) against listed major currencies today. Euro was the strongest against the Japanese Yen.
| USD | EUR | GBP | JPY | CAD | AUD | NZD | CHF | |
|---|---|---|---|---|---|---|---|---|
| USD | 0.08% | -0.00% | 0.16% | 0.06% | -0.11% | -0.19% | -0.03% | |
| EUR | -0.08% | -0.07% | 0.00% | -0.02% | -0.24% | -0.28% | -0.10% | |
| GBP | 0.00% | 0.07% | 0.12% | 0.07% | -0.16% | -0.20% | 0.02% | |
| JPY | -0.16% | 0.00% | -0.12% | -0.01% | -0.32% | -0.35% | 0.12% | |
| CAD | -0.06% | 0.02% | -0.07% | 0.01% | -0.23% | -0.29% | -0.05% | |
| AUD | 0.11% | 0.24% | 0.16% | 0.32% | 0.23% | -0.04% | 0.16% | |
| NZD | 0.19% | 0.28% | 0.20% | 0.35% | 0.29% | 0.04% | 0.37% | |
| CHF | 0.03% | 0.10% | -0.02% | -0.12% | 0.05% | -0.16% | -0.37% |
The heat map shows percentage changes of major currencies against each other. The base currency is picked from the left column, while the quote currency is picked from the top row. For example, if you pick the Euro from the left column and move along the horizontal line to the US Dollar, the percentage change displayed in the box will represent EUR (base)/USD (quote).
More By This Author:
Australian Dollar Advances As US Dollar Trims Gains Amid Fed Rate Cut BetsUSD/CAD Price Forecast: Stays Silent Below 1.3800, Nine-Day EMA
EUR/JPY Price Forecast: Falls To Near 173.00 After Pulling Back From 14-Month Highs
Information on these pages contains forward-looking statements that involve risks and uncertainties. Markets and instruments profiled on this page are for informational purposes only and should not ...
more

