

Image Source: Pixabay
- EUR/JPY loses traction around 156.60, backed by the positive economic outlook from the Japanese government.
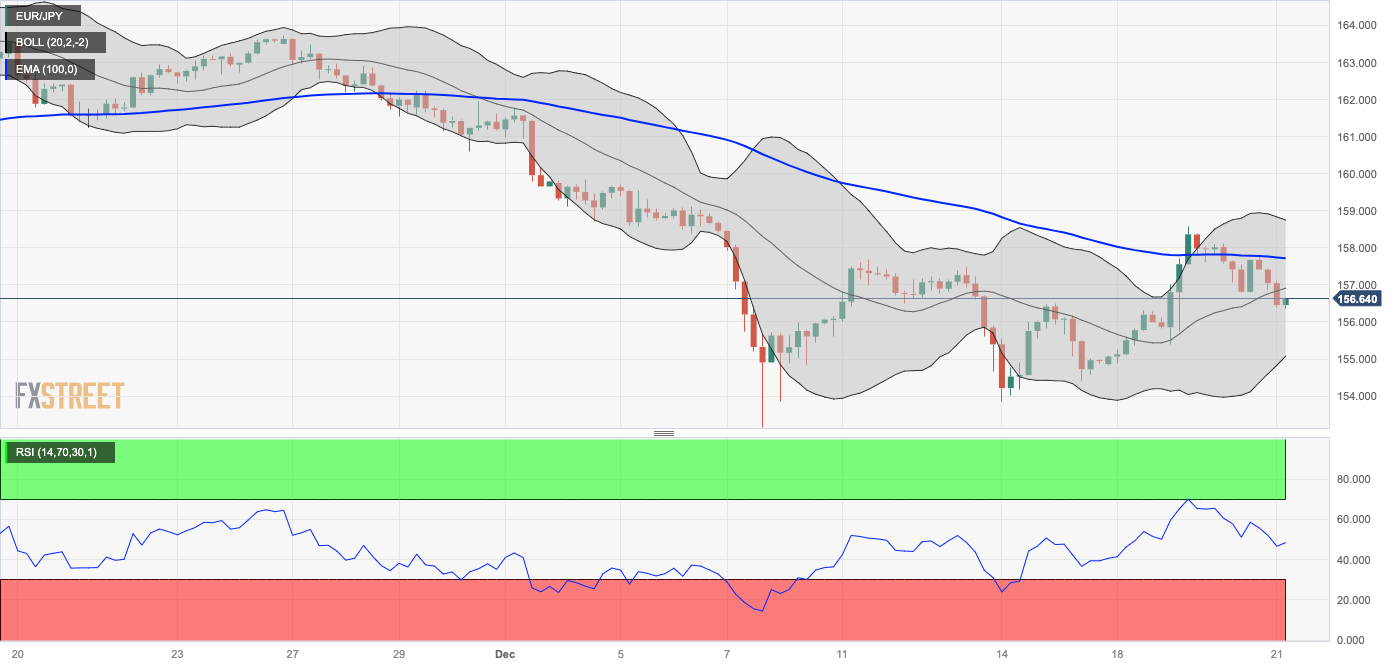
- The cross maintains the bearish vibe as it holds below the key EMA; RSI indicator stands in bearish territory below 50.
- The immediate resistance level is seen at 157.71; the initial support level is located at 155.38.
The EUR/JPY cross extends its downside near 156.60 during the early European session on Thursday. That being said, the upward revision of economic growth estimates by the Japanese government lifts the Japanese Yen (JPY) and creates a headwind for the EUR/JPY cross.
From the technical perspective, EUR/JPY keeps the bearish potential intact as the cross holds below the key 100-hour Exponential Moving Averages (EMAs) on the four-hour chart. Additionally, the 14-day Relative Strength Index (RSI) stands in bearish territory below 50, indicating further downside looks favorable.
Any follow-through buying above the 100-hour EMA at 157.71 will see a rally to a high of December 19 at 158.60. The next upside barrier is seen near the upper boundary of the Bollinger Band at 158.75, en route to a high of December 5 at 159.72.
On the flip side, the initial support level for EUR/JPY is located near a low of December 19 at 155.38. The key contention level will emerge near the lower limit of the Bollinger Band and a psychological level at the 155.00–155.05 zone. A breach of this level will see a drop to a low of December 15 at 154.40. The additional downside filter to watch is a low of December 14 at 153.85.
EUR/JPY four-hour chart
EUR/JPY
| OVERVIEW | |
|---|---|
| Today last price | 156.6 |
| Today Daily Change | -0.54 |
| Today Daily Change % | -0.34 |
| Today daily open | 157.14 |
| TRENDS | |
|---|---|
| Daily SMA20 | 158.74 |
| Daily SMA50 | 159.68 |
| Daily SMA100 | 158.76 |
| Daily SMA200 | 154.52 |
| LEVELS | |
|---|---|
| Previous Daily High | 158.13 |
| Previous Daily Low | 156.79 |
| Previous Weekly High | 157.69 |
| Previous Weekly Low | 153.85 |
| Previous Monthly High | 164.31 |
| Previous Monthly Low | 159.07 |
| Daily Fibonacci 38.2% | 157.3 |
| Daily Fibonacci 61.8% | 157.62 |
| Daily Pivot Point S1 | 156.58 |
| Daily Pivot Point S2 | 156.01 |
| Daily Pivot Point S3 | 155.24 |
| Daily Pivot Point R1 | 157.92 |
| Daily Pivot Point R2 | 158.69 |
| Daily Pivot Point R3 | 159.26 |
More By This Author:
WTI Retraces Its Recent Losses Amid Higher US Crude Inventories, Trades Near $74.00NZD/USD Recovers Its Recent Losses Around The Mid-0.6200s, US GDP Data Eyed
Gold Price Forecast: XAU/USD Consolidates Gains And Threatens The 20-day SMA


Comments
Log in or sign up to join the conversation.