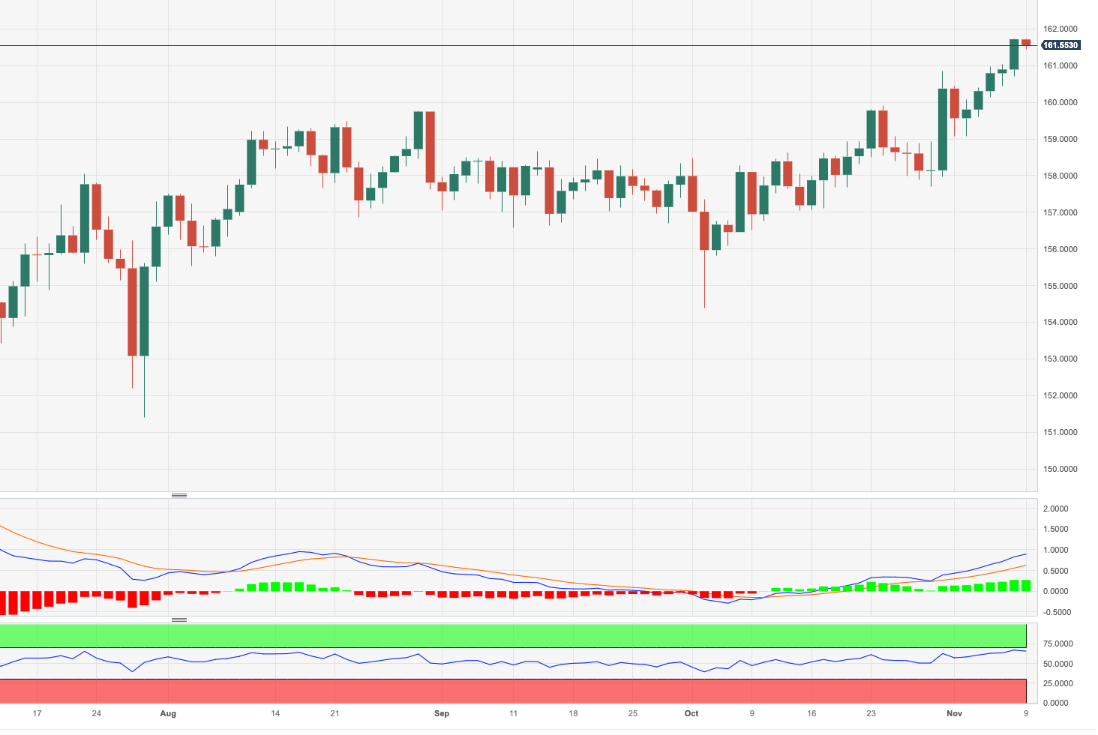
EUR/JPY Price Analysis: The 162.00 Mark Looms Closer
- EUR/JPY prints fresh tops near 161.70 on Thursday.
- Extra gains could advance to the 2008 top near 170.00.
EUR/JPY struggles to advance further despite printing new YTD peaks in the 161.70/75 band on Thursday.
Further upside appears well on the cards for the cross in the short-term horizon. Against that, the surpass of the 2023 high of 161.74 (November 9) is expected to face the next significant resistance level not before the 2008 top of 169.96 (July 23)
So far, the longer-term positive outlook for the cross appears favored while above the 200-day SMA, today at 152.03.
EUR/JPY daily chart
(Click on image to enlarge)
EUR/JPY
| OVERVIEW | |
|---|---|
| Today last price | 161.56 |
| Today Daily Change | 30 |
| Today Daily Change % | -0.10 |
| Today daily open | 161.72 |
| TRENDS | |
|---|---|
| Daily SMA20 | 159.1 |
| Daily SMA50 | 158.22 |
| Daily SMA100 | 157.63 |
| Daily SMA200 | 151.97 |
| LEVELS | |
|---|---|
| Previous Daily High | 161.73 |
| Previous Daily Low | 160.7 |
| Previous Weekly High | 160.85 |
| Previous Weekly Low | 157.7 |
| Previous Monthly High | 160.85 |
| Previous Monthly Low | 154.39 |
| Daily Fibonacci 38.2% | 161.34 |
| Daily Fibonacci 61.8% | 161.09 |
| Daily Pivot Point S1 | 161.04 |
| Daily Pivot Point S2 | 160.35 |
| Daily Pivot Point S3 | 160 |
| Daily Pivot Point R1 | 162.07 |
| Daily Pivot Point R2 | 162.42 |
| Daily Pivot Point R3 | 163.1 |
More By This Author:
Natural Gas Futures: Extra Losses In Store Near TermGold Futures: Further Decline Looks Not Favoured
EUR/USD Price Analysis: Further Weakness Could Revisit 1.0500
Disclosure: Information on this article contains forward-looking statements that involve risks and uncertainties. Markets and instruments profiled on this page are for informational purposes ...
more


