EUR/JPY Price Analysis: Technical Correction Has Further Legs To Go
- EUR/JPY adds to Friday’s pullback around 156.40.
- Further upside could target the weekly top past 163.00.
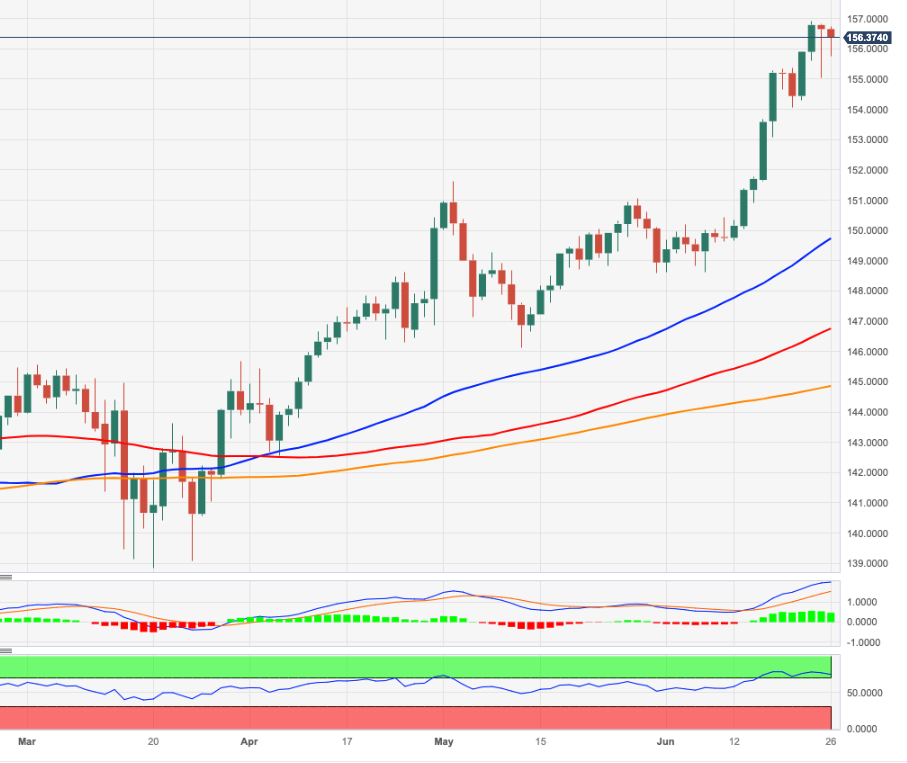
EUR/JPY faces some renewed downside pressure and retreats from recent multi-year peaks in levels just shy of the 157.00 barrier.
In the meantime, further gains appear on the cards, while a clear breakout of the 2023 high at 156.93 (June 22) should meet the next relevant hurdle not before the weekly high of 163.09 (August 22 2008).
The ongoing overbought conditions of the cross, however, are indicative that a deeper knee-jerk should not be ruled out at some point in the short-term horizon.
So far, further upside looks favoured while the cross trades above the 200-day SMA, today at 144.82.
EUR/JPY daily chart
(Click on image to enlarge)
EUR/JPY
| OVERVIEW | |
|---|---|
| Today last price | 156.38 |
| Today Daily Change | 98 |
| Today Daily Change % | -0.17 |
| Today daily open | 156.65 |
| TRENDS | |
|---|---|
| Daily SMA20 | 151.89 |
| Daily SMA50 | 149.87 |
| Daily SMA100 | 146.62 |
| Daily SMA200 | 144.8 |
| LEVELS | |
|---|---|
| Previous Daily High | 156.83 |
| Previous Daily Low | 155.06 |
| Previous Weekly High | 156.93 |
| Previous Weekly Low | 154.05 |
| Previous Monthly High | 151.62 |
| Previous Monthly Low | 146.14 |
| Daily Fibonacci 38.2% | 155.73 |
| Daily Fibonacci 61.8% | 156.15 |
| Daily Pivot Point S1 | 155.53 |
| Daily Pivot Point S2 | 154.41 |
| Daily Pivot Point S3 | 153.76 |
| Daily Pivot Point R1 | 157.3 |
| Daily Pivot Point R2 | 157.95 |
| Daily Pivot Point R3 | 159.07 |
More By This Author:
Natural Gas Futures: Rally Could Be Losing MomentumUSD Index Price Analysis: Losses Could Accelerate Below 102.00
Crude Oil Futures: Room For Extra Retracements
Disclosure: Information on this article contains forward-looking statements that involve risks and uncertainties. Markets and instruments profiled on this page are for informational purposes ...
more


