EUR/JPY Price Analysis: Interim Contention Emerges At 158.80
- EUR/JPY adds to Thursday’s corrective decline.
- Further losses appear on the cards near term.
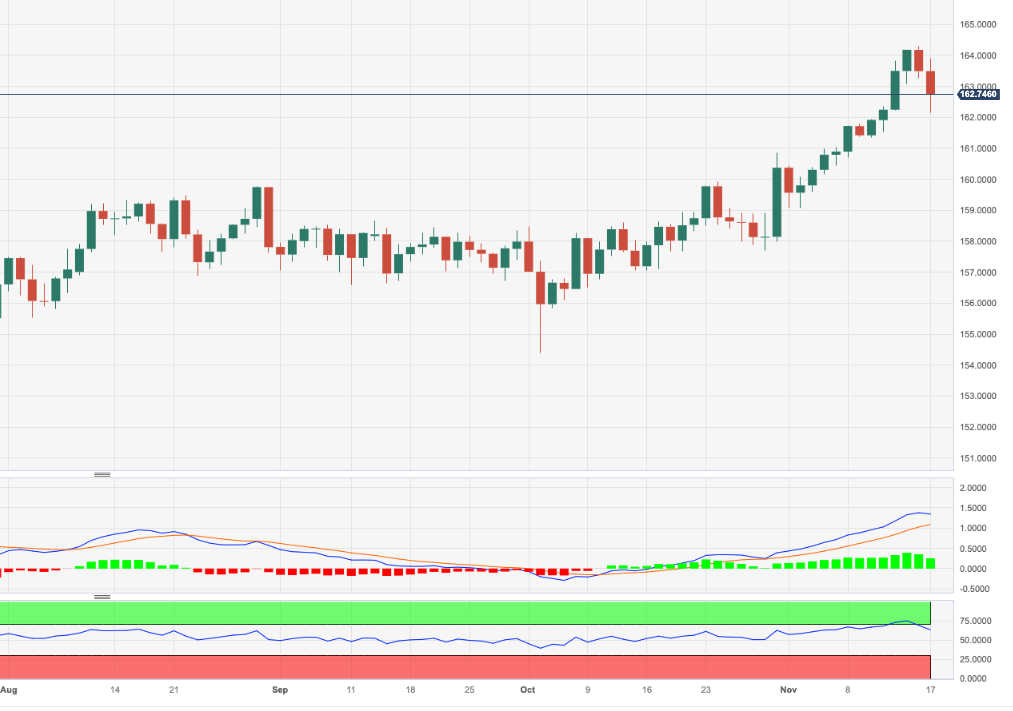
EUR/JPY comes under extra selling pressure following Thursday’s 2023 peaks north of the 164.00 hurdle.
The continuation of the retracement from overbought levels appears on the cards for the time being. Against that, the cross could initially revisit the provisional 55-day SMA near 158.80 prior to the weekly low of 157.69 (October 30).
So far, the longer term positive outlook for the cross appears favoured while above the 200-day SMA, today at 152.68.
EUR/JPY daily chart
(Click on image to enlarge)
EUR/JPY
| OVERVIEW | |
|---|---|
| Today last price | 162.79 |
| Today Daily Change | 145 |
| Today Daily Change % | -0.43 |
| Today daily open | 163.49 |
| TRENDS | |
|---|---|
| Daily SMA20 | 160.55 |
| Daily SMA50 | 158.8 |
| Daily SMA100 | 157.97 |
| Daily SMA200 | 152.61 |
| LEVELS | |
|---|---|
| Previous Daily High | 164.31 |
| Previous Daily Low | 163.26 |
| Previous Weekly High | 161.95 |
| Previous Weekly Low | 160.15 |
| Previous Monthly High | 160.85 |
| Previous Monthly Low | 154.39 |
| Daily Fibonacci 38.2% | 163.66 |
| Daily Fibonacci 61.8% | 163.91 |
| Daily Pivot Point S1 | 163.06 |
| Daily Pivot Point S2 | 162.63 |
| Daily Pivot Point S3 | 162.01 |
| Daily Pivot Point R1 | 164.11 |
| Daily Pivot Point R2 | 164.74 |
| Daily Pivot Point R3 | 165.17 |
More By This Author:
Crude Oil Futures - A Deeper Drop Seems Not FavoredNatural Gas Futures: Extra Losses On The Table
Gold Futures: Further Gains In The Pipeline
Disclosure: Information on this article contains forward-looking statements that involve risks and uncertainties. Markets and instruments profiled on this page are for informational purposes ...
moreComments
Please wait...
Comment posted successfully
No Thumbs up yet!


