
- EUR/JPY alternates gains with losses around 140.50 midweek.
- The 143.00 region remains a tough near-term resistance zone.
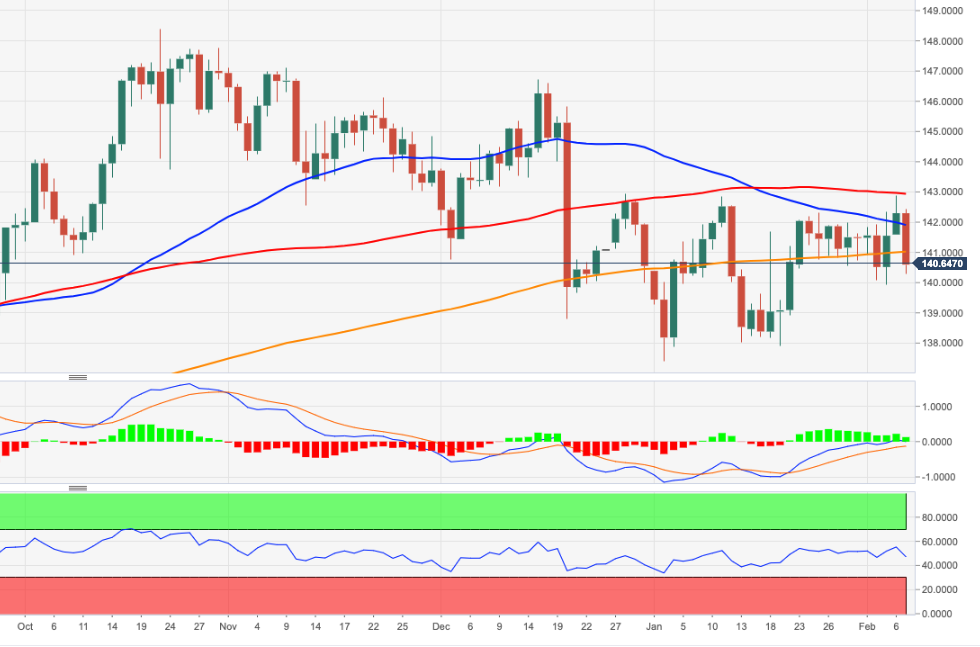
EUR/JPY navigates within a narrow range in the mid-140.00s following Tuesday’s sharp sell-off.
While the cross is expected to maintain the side-lined theme in the short term, the 143.00 area remains a solid barrier for bulls. This key resistance zone also appears reinforced by the 100-day SMA, today at 142.89
If the cross breaches the 200-day SMA at 141.00 in a sustainable fashion, the outlook is expected to shift to bearish.
EUR/JPY daily chart
(Click on image to enlarge)
EUR/JPY
| OVERVIEW | |
|---|---|
| Today last price | 140.55 |
| Today Daily Change | 64 |
| Today Daily Change % | -0.04 |
| Today daily open | 140.6 |
| TRENDS | |
|---|---|
| Daily SMA20 | 140.76 |
| Daily SMA50 | 141.68 |
| Daily SMA100 | 142.94 |
| Daily SMA200 | 141.02 |
| LEVELS | |
|---|---|
| Previous Daily High | 142.44 |
| Previous Daily Low | 140.29 |
| Previous Weekly High | 142.34 |
| Previous Weekly Low | 139.93 |
| Previous Monthly High | 142.86 |
| Previous Monthly Low | 137.39 |
| Daily Fibonacci 38.2% | 141.11 |
| Daily Fibonacci 61.8% | 141.62 |
| Daily Pivot Point S1 | 139.78 |
| Daily Pivot Point S2 | 138.96 |
| Daily Pivot Point S3 | 137.62 |
| Daily Pivot Point R1 | 141.93 |
| Daily Pivot Point R2 | 143.26 |
| Daily Pivot Point R3 | 144.08 |
More By This Author:
Natural Gas Futures: Extra Upside Remains In Store Near TermEUR/USD Price Analysis: Decline Could Pick Up Pace Below 1.0770
USD Index Price Analysis: Recovery Looks Firm Near Term


Comments
Log in or sign up to join the conversation.