Friday, March 22, 2024 10:07 AM EST
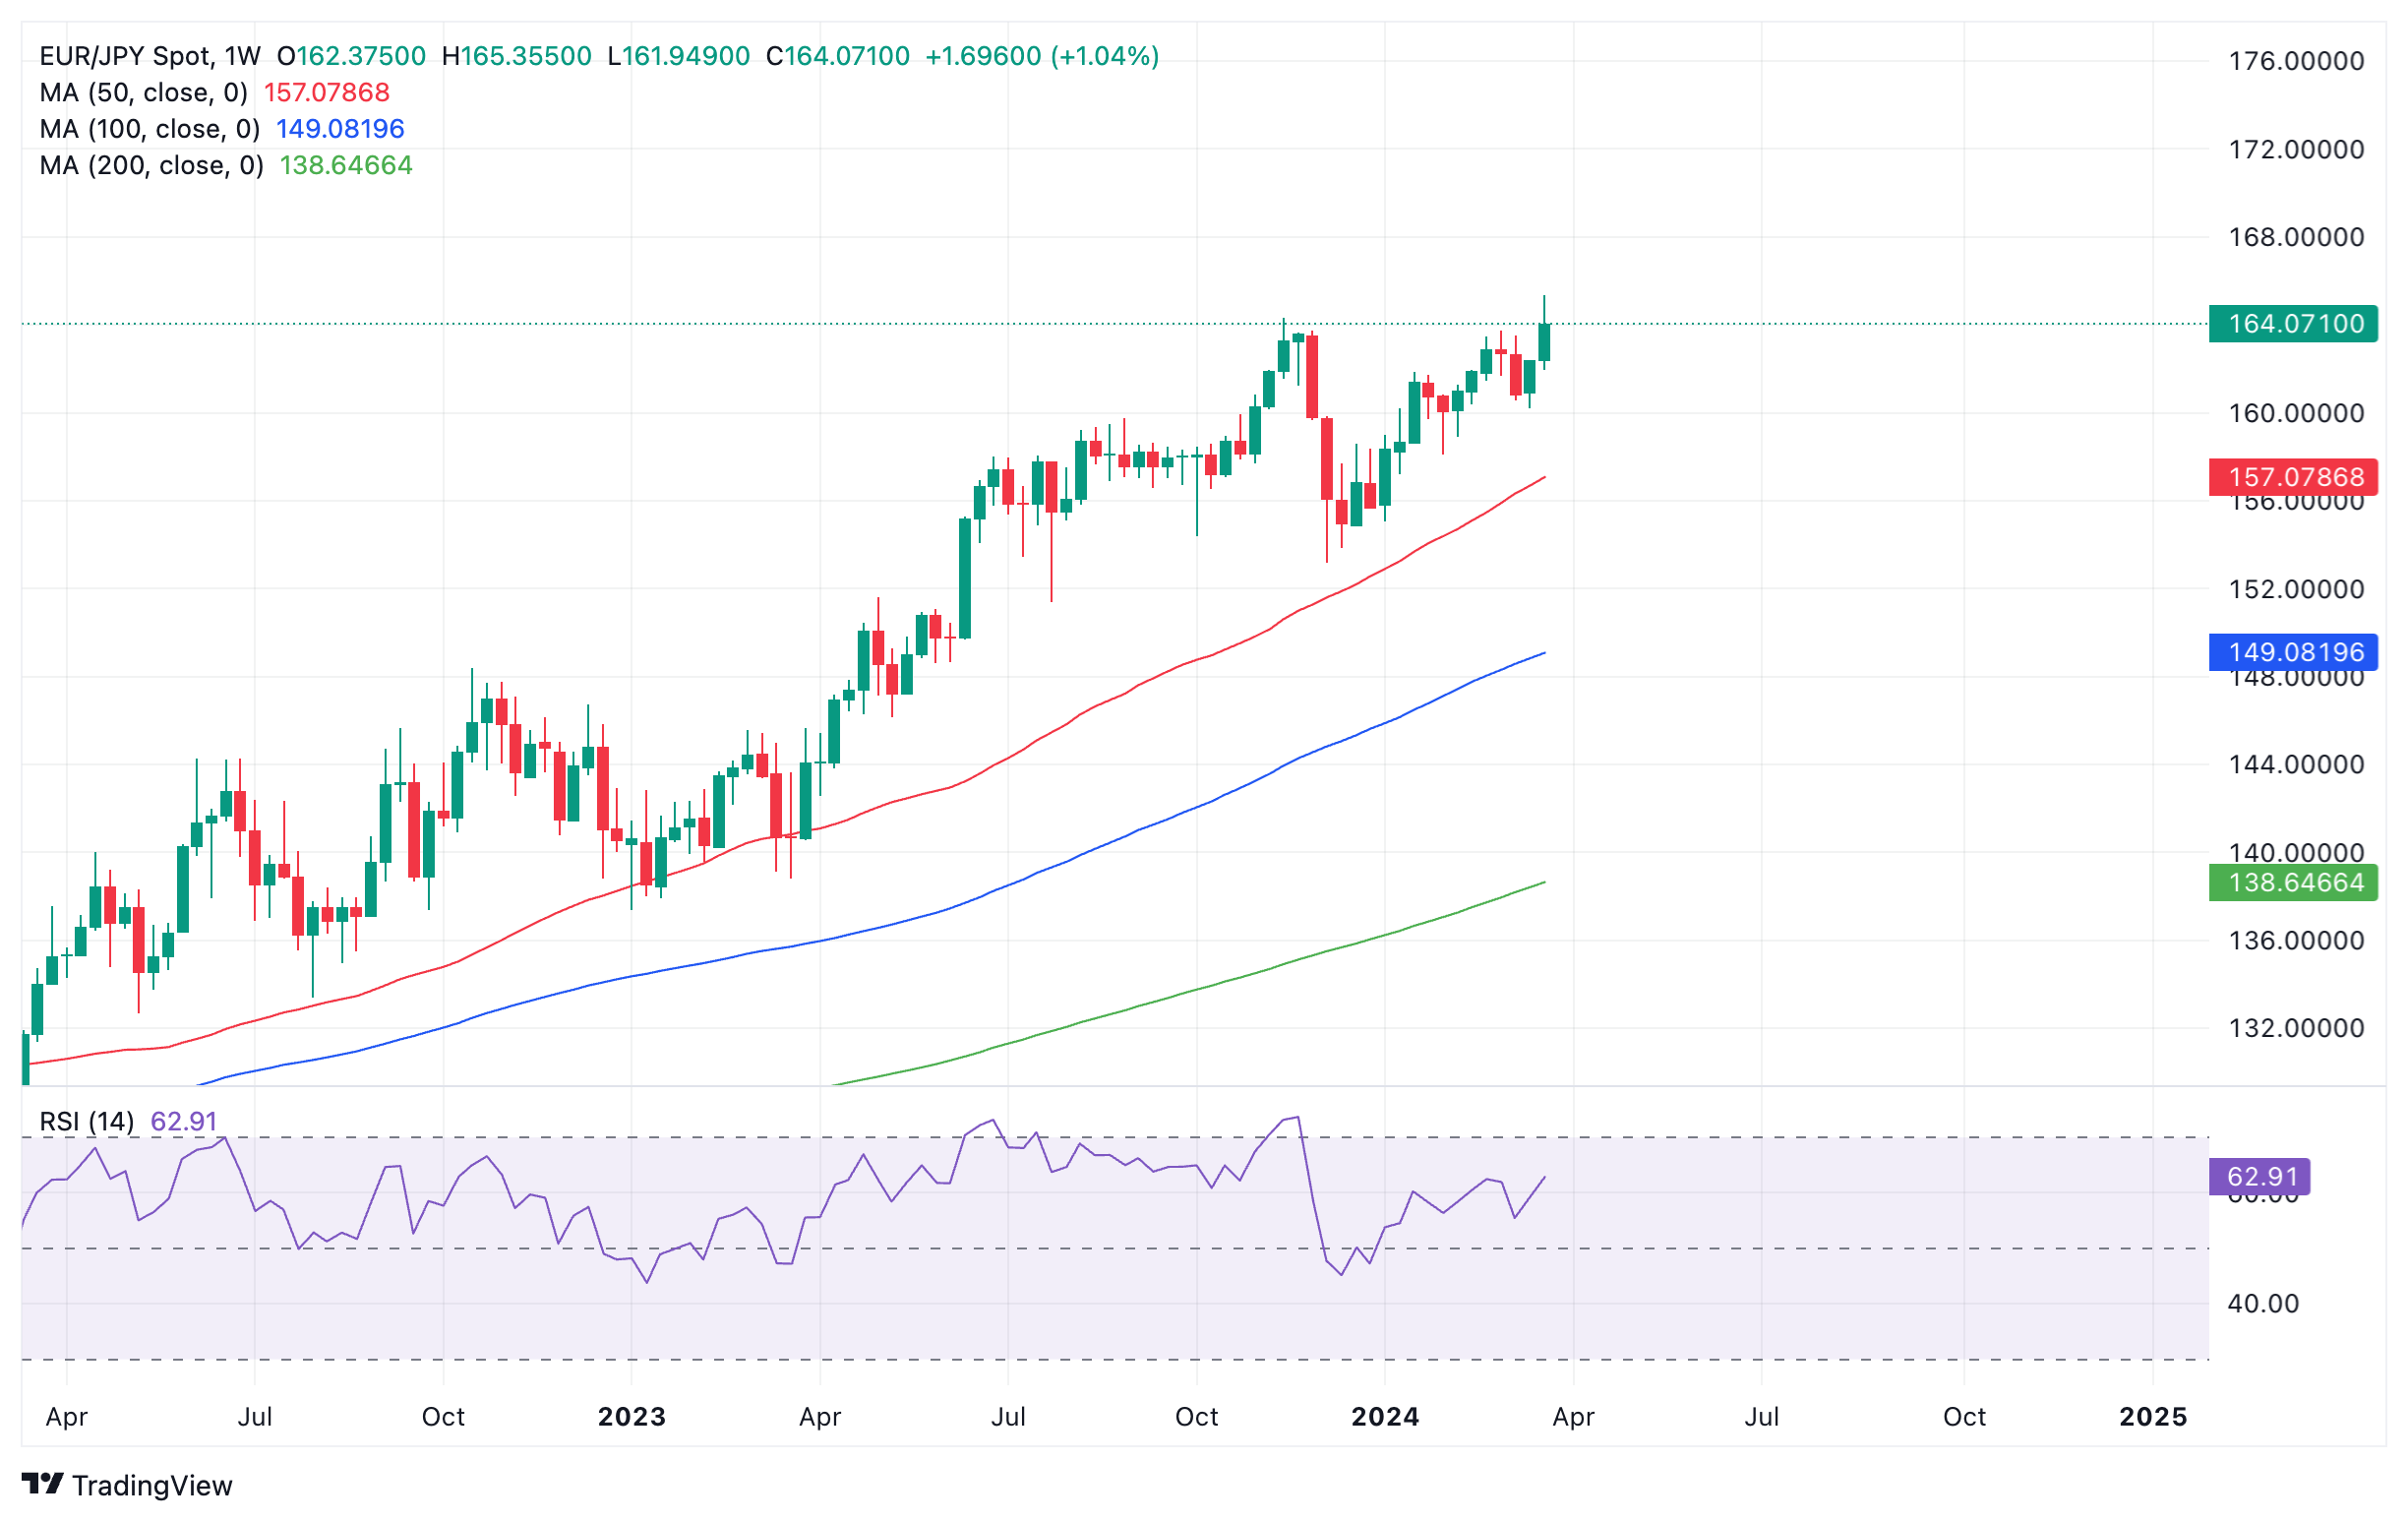
- EUR/JPY is showing acute bearish divergence on the weekly chart compared to 2023.
- This indicates the potential for a pullback on the horizon.
- A negative close next week would provide further evidence of a correction forming.
EUR/JPY is in a long-term uptrend distinguished by the rising peaks and troughs in price on the weekly chart.
The pair’s price has formed a bearish divergence with the Relative Strength Index (RSI) in the current week when compared with the similar high in November 2023.

Euro versus Japanese Yen: Weekly chart
Divergence occurs when price reaches a higher high but the RSI fails to follow. It is a sign of underlying weakness in the asset price and a precursor to a possible correction. In the case of EUR/JPY the new multi-year high reached this week was not accompanied by a higher high in the RSI when compared with the high in November 2023.
The divergence is quite acute suggesting a stronger possibility it could indicate a subsequent bearish pullback in price.
A natural target for a pullback if it develops would be the red 50-week Simple Moving Average (SMA) at 157.080.
If the next week is bearish that would add credence to the view there will be a correction signaled by the divergence.
More By This Author:
EUR/USD Tests 200-day Average With Key Central Bank Speakers Waiting In The Wings Japanese Yen Languishes Near YTD Low Against USD, Seems Vulnerable To Slide Further AUD/USD Falls Back To Lows Of The Day After Release Of US Data
Information on these pages contains forward-looking statements that involve risks and uncertainties. Markets and instruments profiled on this page are for informational purposes only and should not ...
more
Information on these pages contains forward-looking statements that involve risks and uncertainties. Markets and instruments profiled on this page are for informational purposes only and should not in any way come across as a recommendation to buy or sell in these assets. You should do your own thorough research before making any investment decisions. FXStreet does not in any way guarantee that this information is free from mistakes, errors, or material misstatements. It also does not guarantee that this information is of a timely nature. Investing in Open Markets involves a great deal of risk, including the loss of all or a portion of your investment, as well as emotional distress. All risks, losses and costs associated with investing, including total loss of principal, are your responsibility. The views and opinions expressed in this article are those of the authors and do not necessarily reflect the official policy or position of FXStreet nor its advertisers. The author will not be held responsible for information that is found at the end of links posted on this page.
If not otherwise explicitly mentioned in the body of the article, at the time of writing, the author has no position in any stock mentioned in this article and no business relationship with any company mentioned. The author has not received compensation for writing this article, other than from FXStreet.
FXStreet and the author do not provide personalized recommendations. The author makes no representations as to the accuracy, completeness, or suitability of this information. FXStreet and the author will not be liable for any errors, omissions or any losses, injuries or damages arising from this information and its display or use. Errors and omissions excepted.
The author and FXStreet are not registered investment advisors and nothing in this article is intended to be investment advice.
less
How did you like this article? Let us know so we can better customize your reading experience.


