EUR/GBP Technical Analysis: Continues Sideways, Capped By 20-Day SMA

Image Source: Pixabay
- Pair trades sideways within a narrow range, indicating indecisive market sentiment.
- RSI suggests increasing selling pressure, while MACD signals weakening bullish momentum.
- The pair remains below the 20-day SMA, indicating a bearish bias in the short term
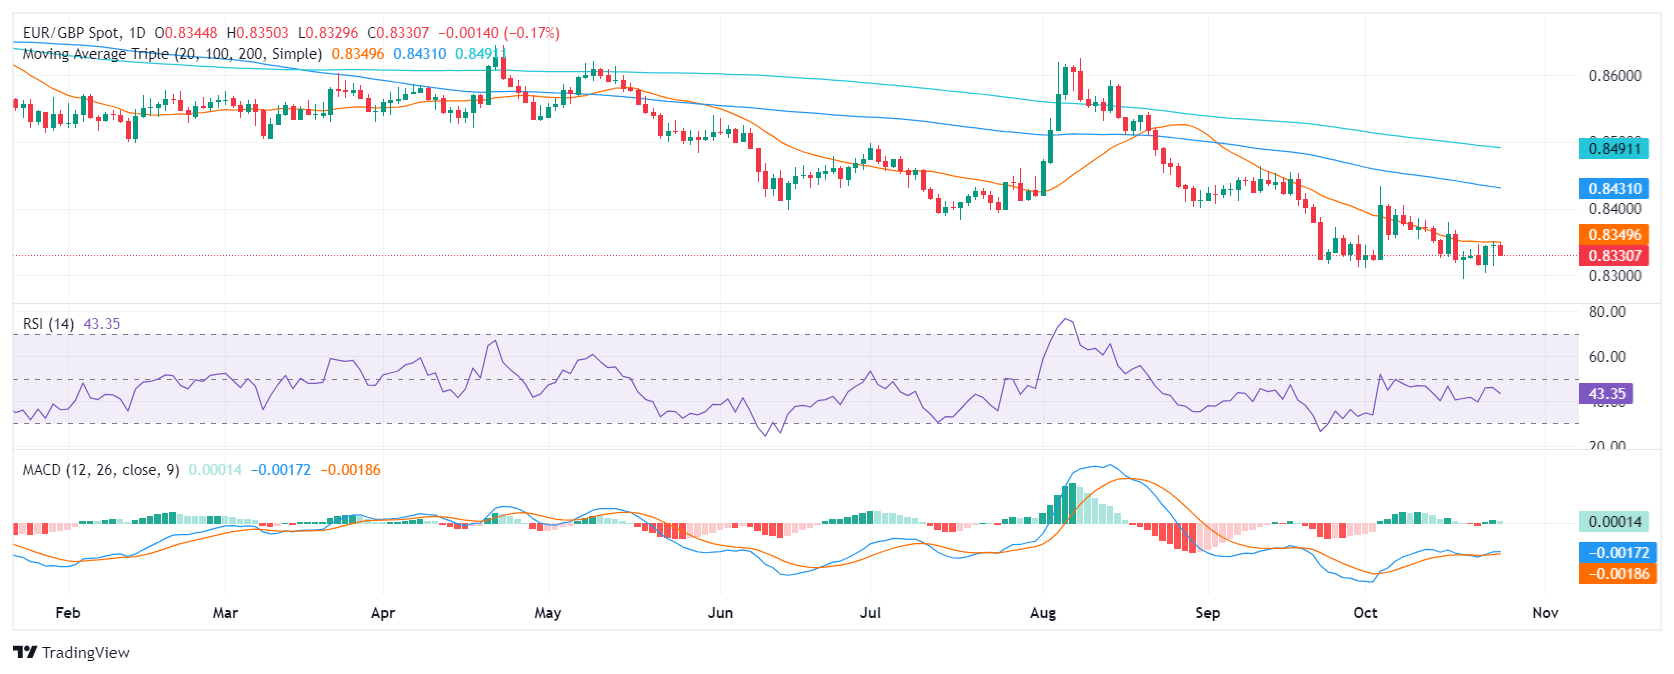
EUR/GBP continues to trade within a constricted range, with limited price movements in recent sessions. The pair currently trades near 0.8340 having faced resistance at the 20-day SMA, maintaining a neutral bias.
Analyzing the technical indicators, the Relative Strength Index (RSI) has declined to 45, suggesting increasing selling pressure. The MACD, while still in positive territory, is decreasing, indicating weakening buying momentum. This confluence of signals points to a neutral to slightly bearish bias in the short term.
Support levels are seen at 0.8330, 0.8315, and 0.8300, while resistance levels stand at 0.8350, 0.8370, and 0.8400. In the near term, the pair is likely to continue trading within this range unless buyers manage to break above the 20-day SMA, thereby shifting the technical outlook more favorably.
EUR/GBP daily chart
More By This Author:
Japanese Yen Lacks Any Firm Intraday Direction; USD/JPY Holds Steady Above Mid-151.00sGBP/CAD Price Forecast: Possibly Extending Higher In Rising Wedge Pattern
USD/CAD Price Forecast: Bulls Have The Upper Hand Despite Corrective Slide, 1.3800 Holds The Key
Information on these pages contains forward-looking statements that involve risks and uncertainties. Markets and instruments profiled on this page are for informational purposes only and should not ...
more


