
- Price has touched support at 0.8500 on multiple occasions.
- This reinforces the importance of the level.
- Should EUR/GBP eventually break below it, the decline is likely to be deep and strong.
EUR/GBP is bouncing once again off a long-term support floor at around 0.8500 and recovering.
The support level is key to the technical outlook for the pair, for if EUR/GBP breaks decisively below it, it will lead to a volatile move down, that could extend quite far.
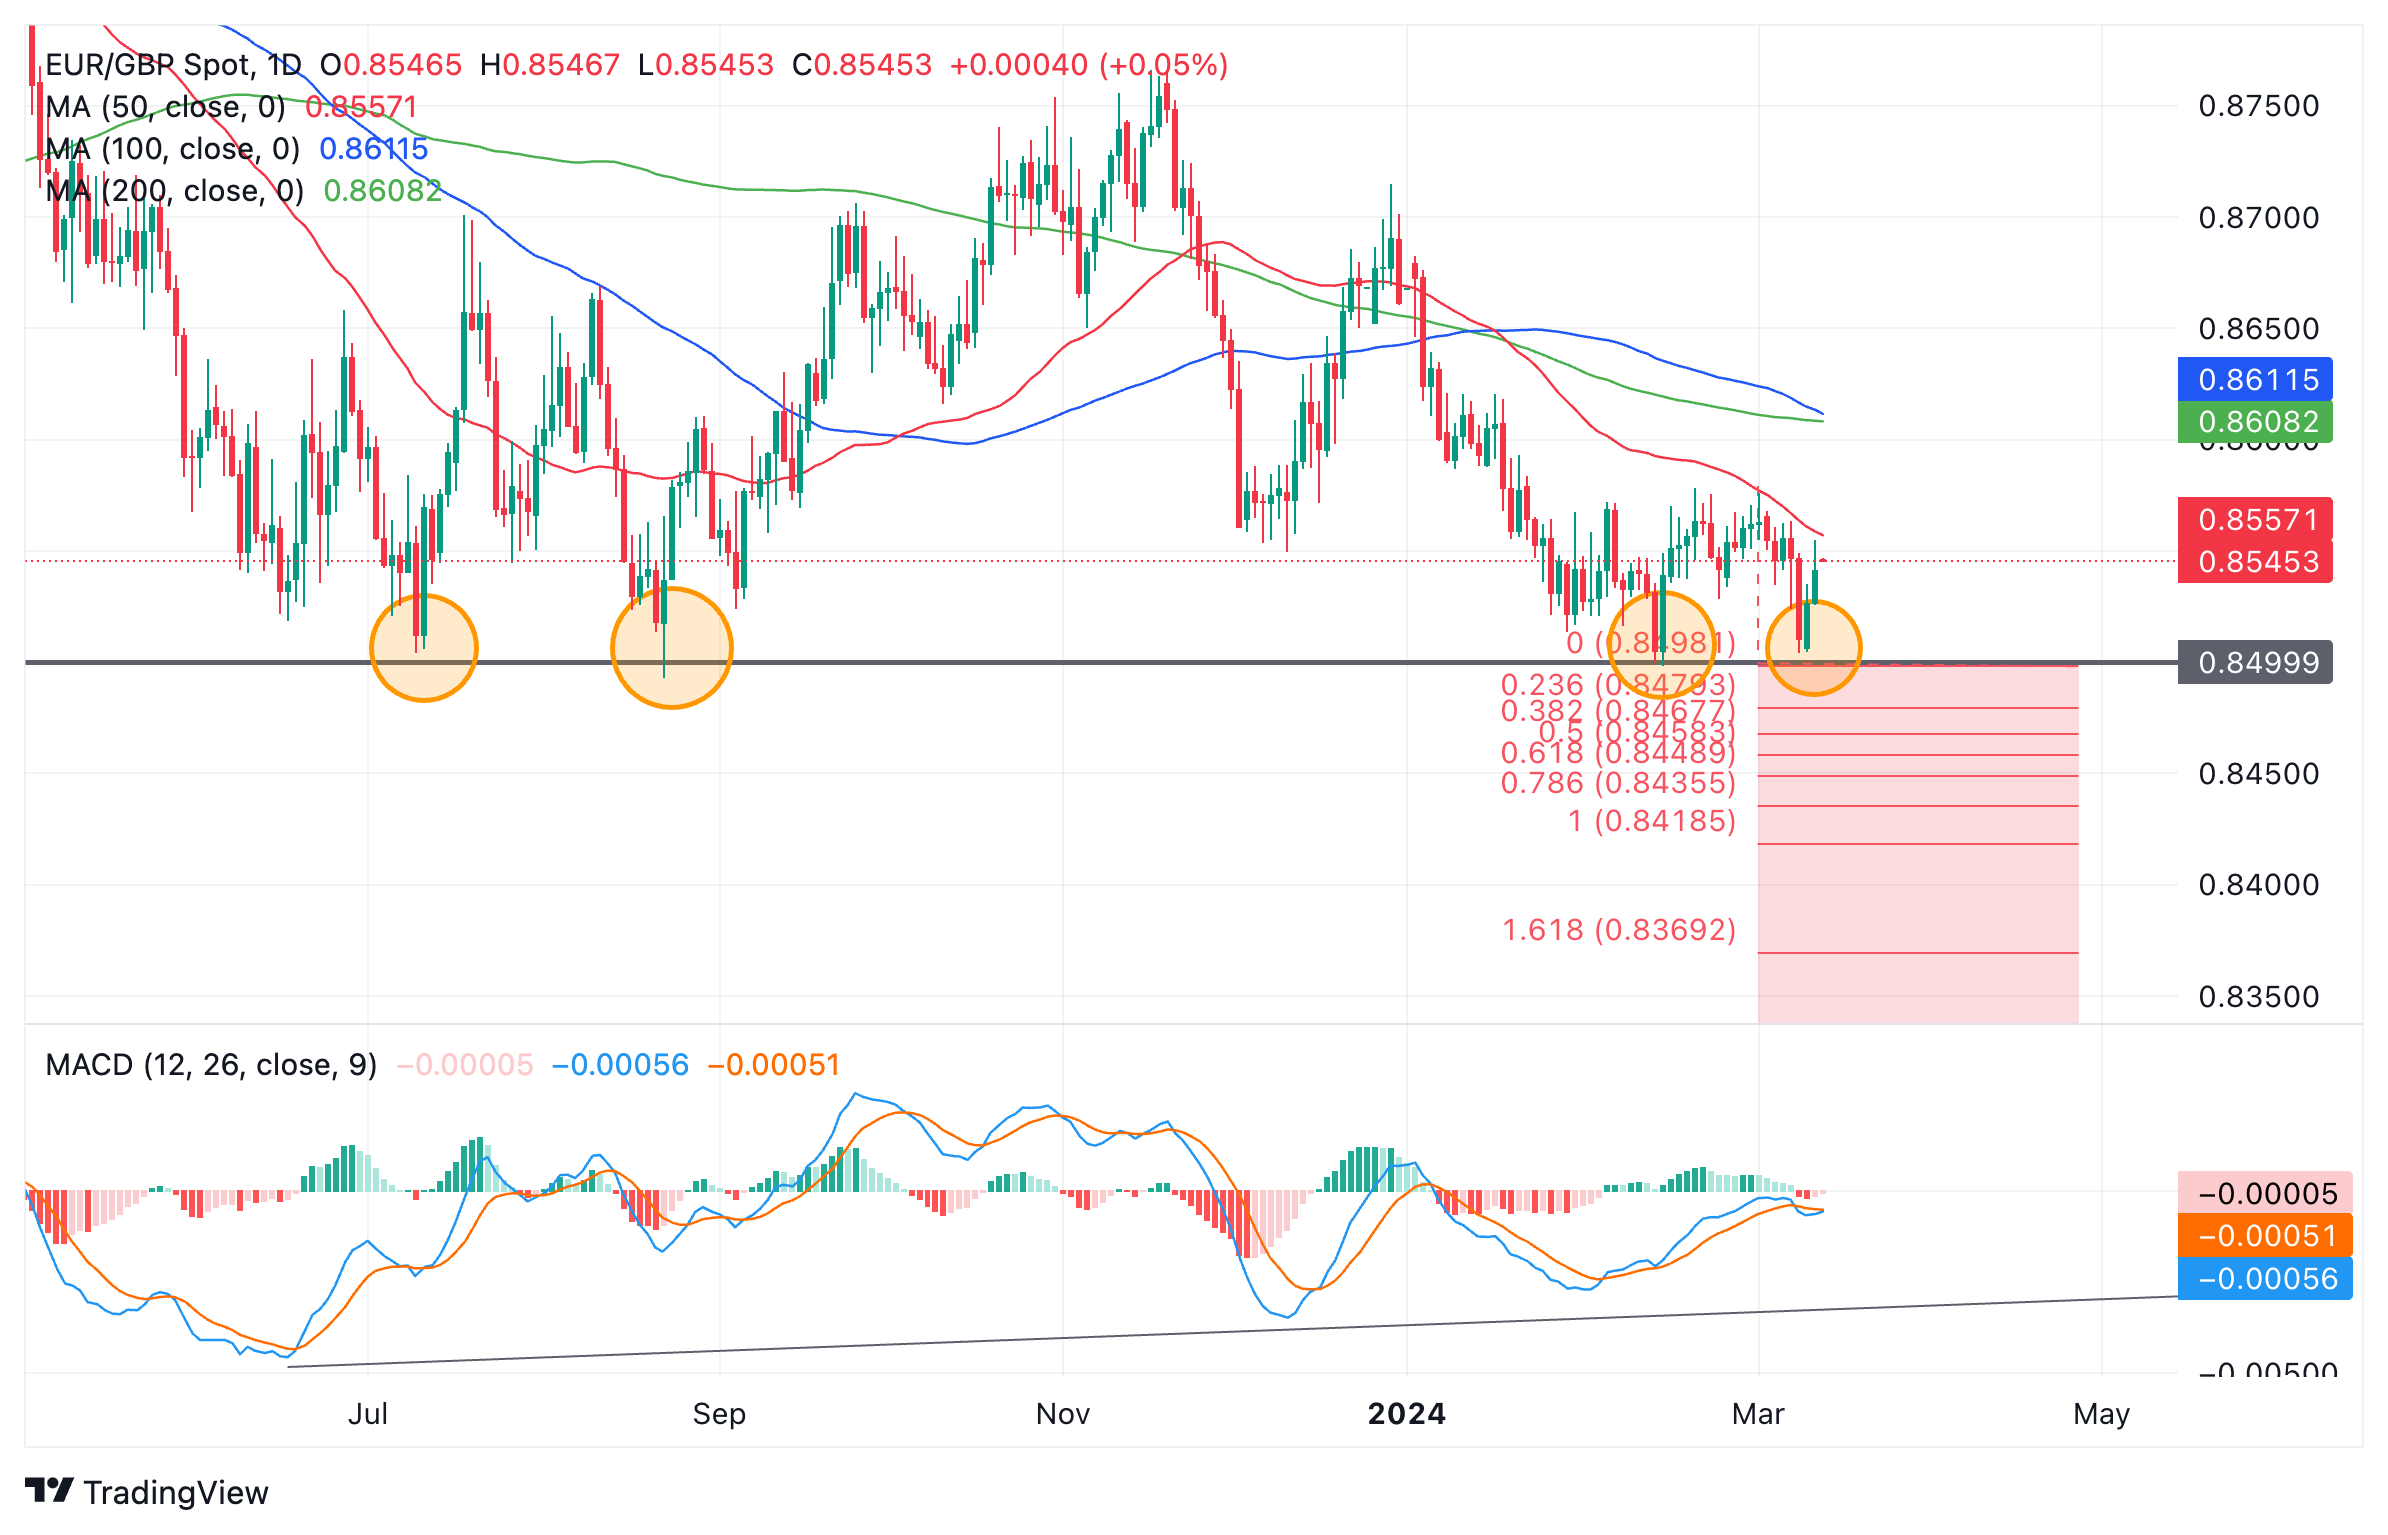
Euro to Pound Sterling: Daily chart
The 0.8500 level has been touched multiple times over the past year – four in total from the chart above (circled).
The greater the number of times a support or resistance level has been touched but not broken, the more significant it becomes as a chart level, according to technical analysis theory.
Multiple touches also lead to an eventual break that is more volatile and extreme, suggesting that should 0.8500 fall, the subsequent breakdown will be swift and brutal. This is also the time when the market often forms gaps.
How far is the move likely to go? The usual method for determining how far a move will go following a break is to take the height of the range that preceded the break and extrapolate it lower.
In the case of EUR/GBP this is difficult, however, since price has not formed a neat and tidy range. To be conservative I have taken the height of the consolidation in February and March. The result is that should the price break below 0.8500 it will probably reach a target of 0.8418. The 0.618 Fibonacci ratio extension is also often quoted as a conservative estimate, that lies at 0.8449.
It is also possible the price could fall even lower, to the 1.618 Fibonacci extension at 0.8369.
One indication that runs contrary to the expectation that EUR/GBP will break lower, however, is that the Moving Average Convergence/ Divergence (MACD) indicator is converging bullishly with price.
This means that with each touch of the support level at 0.8500 the MACD has waned, revealing lessening momentum. This does not discount the possibility of a volatile breakdown but it does introduce some doubt it will occur.
More By This Author:
EUR/USD Extends Pullback Into MidweekWTI Lacks Any Firm Intraday Direction, Stuck In A Range Below $78.00 Mark Amid Mixed Cues
EUR/USD Price Analysis: Stuck In A Range Below 100-Hour SMA Pivotal Resistance


Comments
Log in or sign up to join the conversation.