

Image Source: Unsplash
EURGBP is moving nicely as expected within a three-wave abc corrective setback in wave B after reaching April highs for wave »v« of an impulse into wave A, as shared with our members back on July 31.
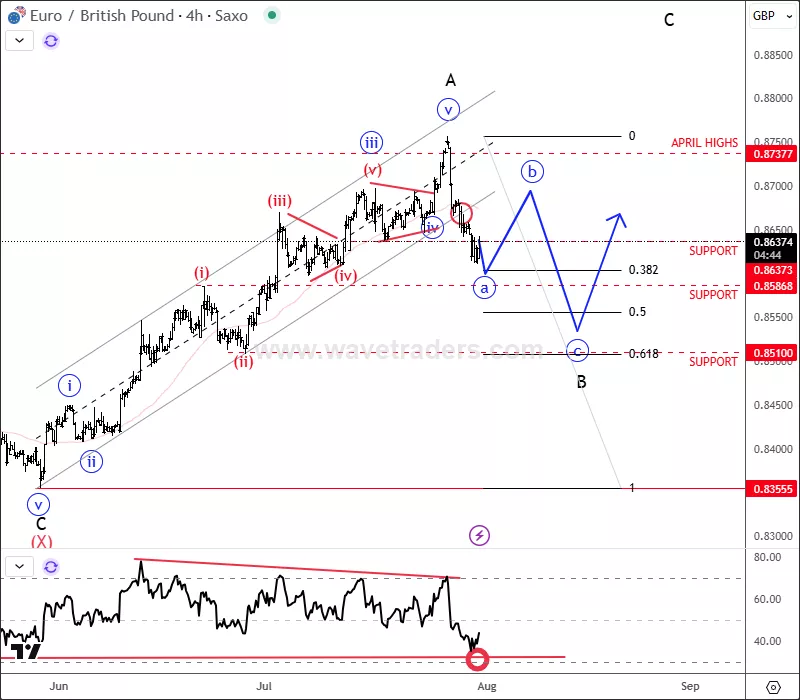
EURGBP 4H Chart From July 31: www.wavetraders.com
It’s actually nicely approaching projected support around 0.8600 level or slightly lower for wave “c” of a three-wave abc correction in wave B, so as soon as it fully unfolds, we will expect a continuation higher for wave C.
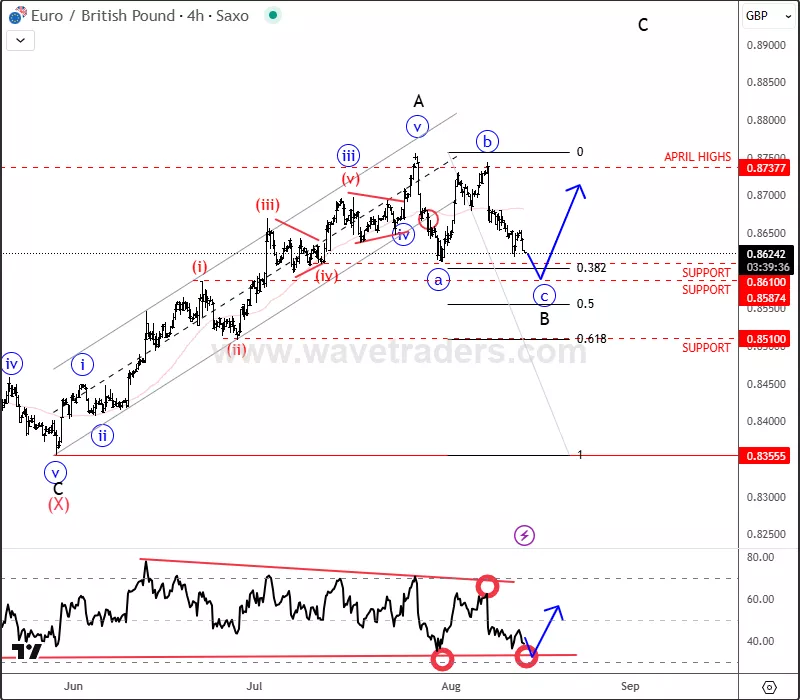
EURGBP 4H Chart From August 13: www.wavetraders.com
From a technical analysis perspective, support levels such as 0.8600 are key decision points where traders often watch for changes in momentum. These areas can attract buying interest, particularly when they align with well-defined chart patterns or Fibonacci retracement zones.
In Elliott Wave theory, price movements unfold in a repeating sequence of motive and corrective phases. Motive waves (like wave C in our case) typically move in the direction of the broader trend, while corrective waves (like the current wave B) retrace part of that move. The ABC corrective pattern seen here is a classic structure, where waves a and c move in the same direction, separated by a countertrend wave b. Identifying these phases helps traders anticipate the next potential move and manage risk more effectively.
In this scenario, the completion of wave B could pave the way for a strong upward push in wave C, provided support holds and momentum shifts back in favor of buyers.
More By This Author:
Ebay Extends The Rally; Pointing To 100 Area
Crypto Market Is Still Bullish Eyeing 4T Area; ALTseason Still Here?
DXY Is Still Bearish; Final Leg Of The Wedge Pattern?


Comments
Log in or sign up to join the conversation.