

Image Source: Unsplash
We talked about EURGBP pair back on May 24th, where we mentioned and highlighted a completed bearish triangle pattern in wave (B), which can send the price lower within wave (C).
EURGBP Daily Chart From May 24th 2024
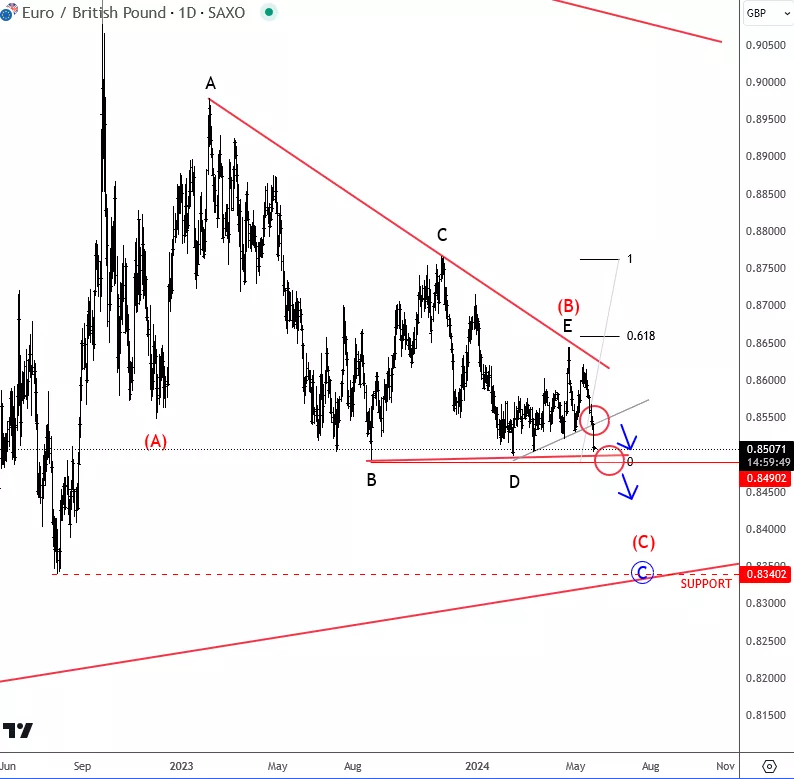
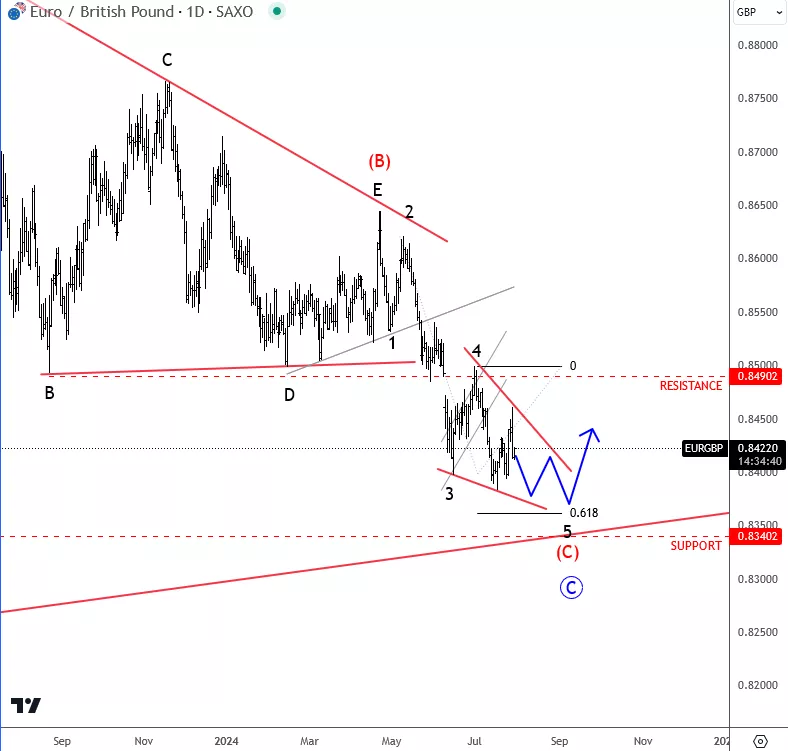
As you can see today after two months on July 30th, the pair is coming to the lower side of that big range, with room for 0.8350 area after recent sell-off from the upper line of a daily triangle. So, wave (C) of C is clearly in progress but already seen in 5th subwave down, so possibly the pair can be in late stages of current drop, maybe even within the wedge pattern, thus be aware of price stabilization and potential reversal up, especially if BoE is going to cut interest rates.
EURGBP Daily Chart From July 30th 2024
For more analysis like this you may want to watch below our recording of a live webinar streamed on Monday July 29 2024:
Video Length: 00:39:38
More By This Author:
Ethereum Is Poised For More Gains
ETH/USD: Buy Next Dip
XRP: Big Upside Potential After Retracement


Comments
Log in or sign up to join the conversation.