Ethereum Price Analysis: ETH/USD Bulls Don’t Know How To Break This Trap
- ETH/USD stuck in a channel that won’t be easy on bulls.
- Medium term charts point to some gains and then battle.
The second largest cryptocurrency by market capitalization, Ethereum, has a tough time to regain its lost glory as the price of this crypto has been stuck in a lower high, lower low downward sloping trendline channel that won’t be an easy nut for bulls to crack.
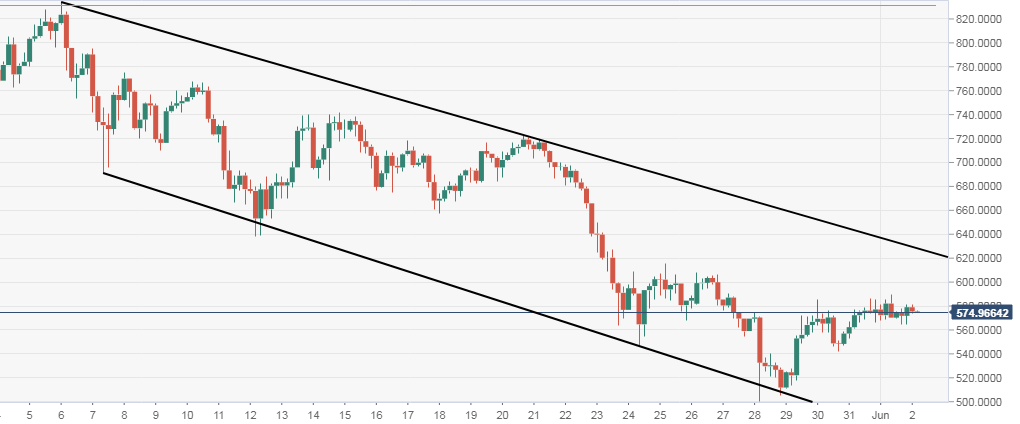
ETH/USD is down half a percent at $575.608, near the low point of the day, which is at $573.83. On the 240-minute chart, ETH is shackled in a downward sloping trendline channel and now faces resistance above round-figure mark of $600.
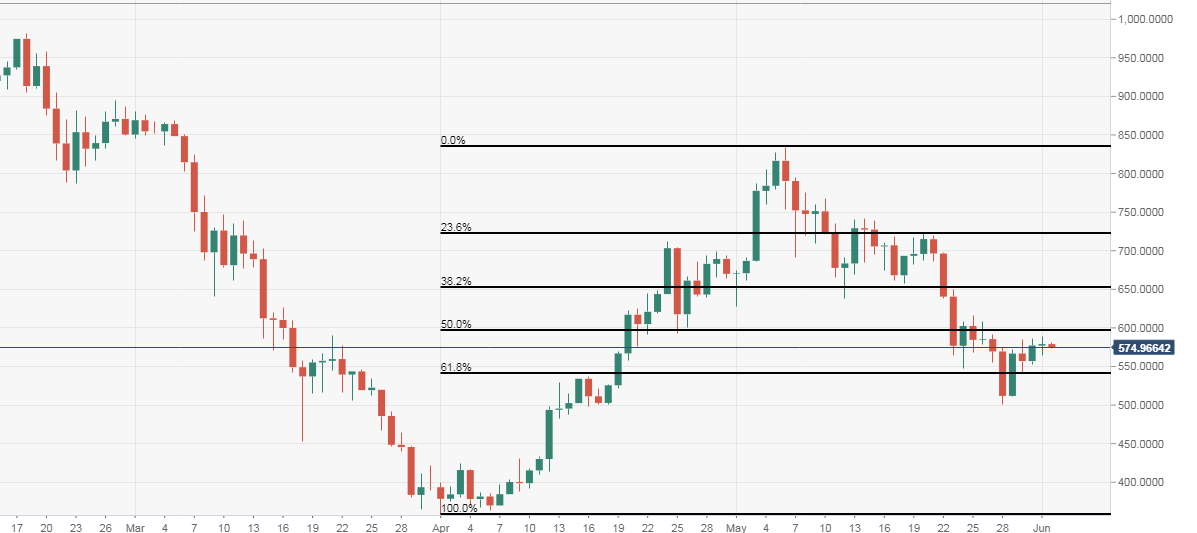
Daily chart’s 50 percnet fibonacci retracement of recent rise from April lows, also co-incides with $620 mark where the bulls will have to try as hard as they can to come out of the trendline channel of 240-minute chart.
ETH/USD 240-minute chart:
ETH/USD daily chart