Elliott Wave Technique Forecasts EURUSD To Extend Lower

Image Source: Pixabay
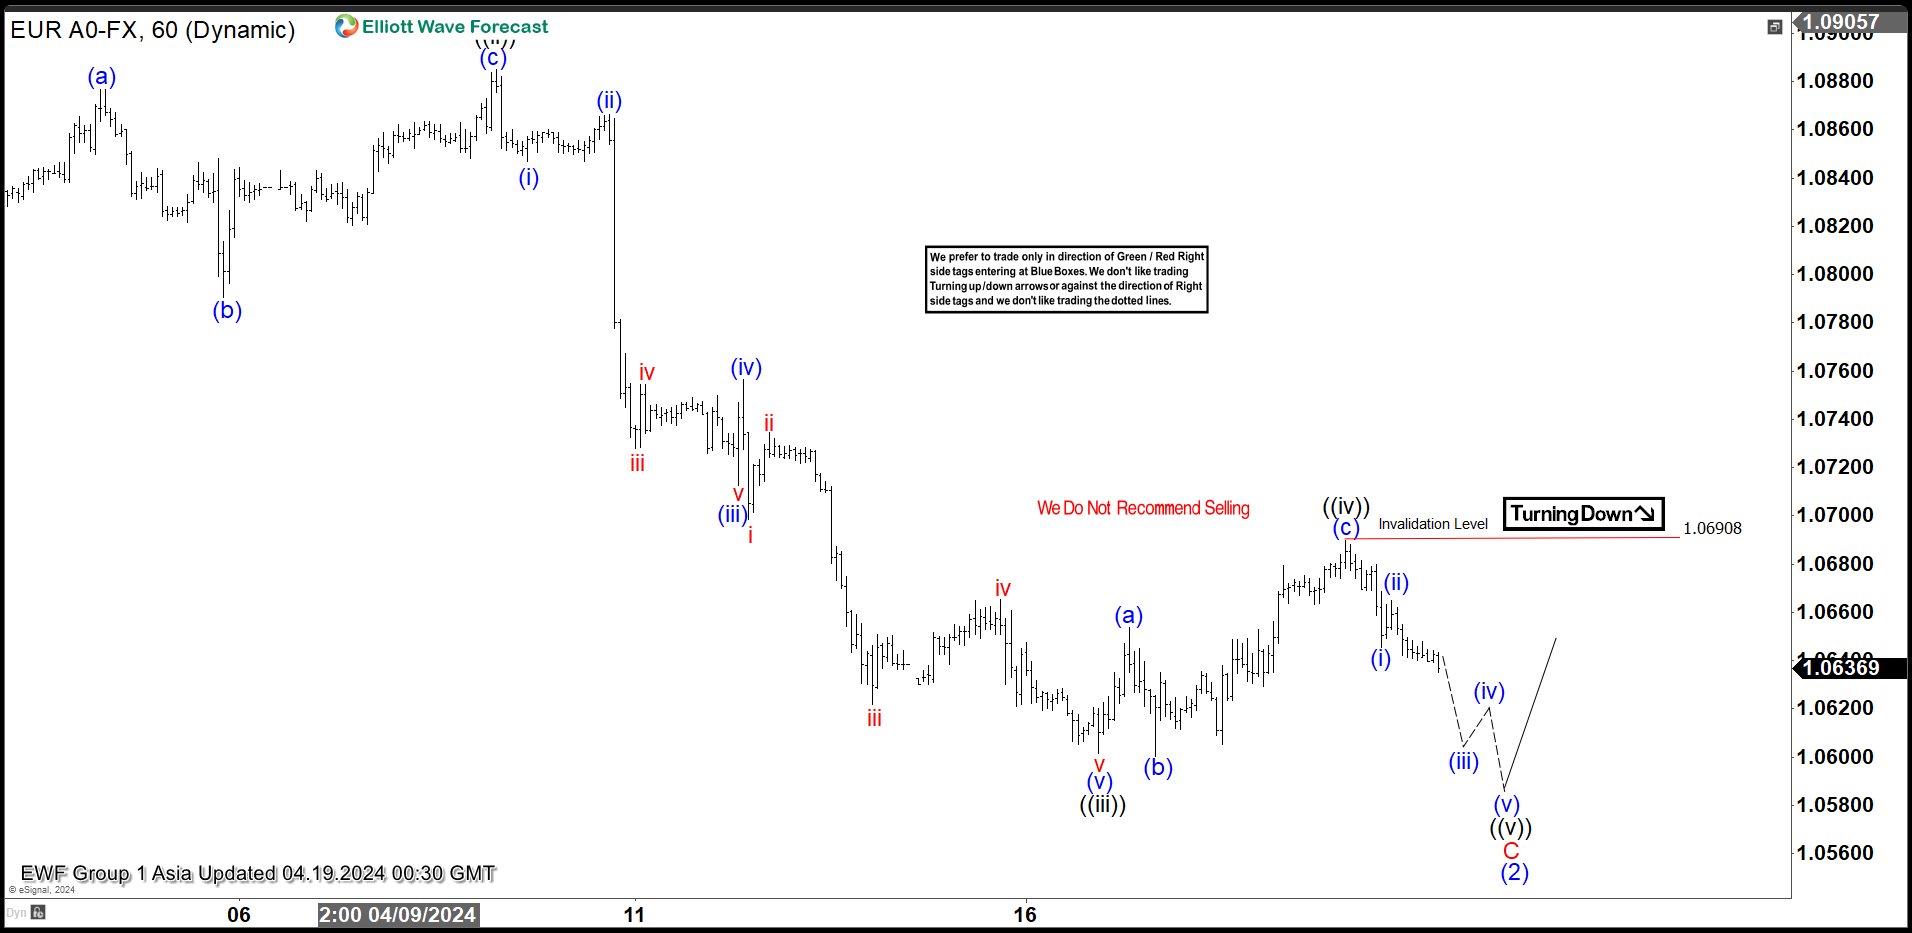
The short-term Elliott Wave view in EURUSD suggests that the cycle from 12.28.2023 high is in progress as a zigzag Elliott Wave structure. Down from 12.28.2023 high, wave A ended at 1.0694, and the rally in wave B ended at 1.098. Wave C lower is in progress as a 5-wave impulse Elliott Wave structure. Down from wave B, wave ((i)) ended at 1.072, and rally in wave ((ii)) ended at 1.0885. Pair extends lower in wave ((iii)) with internal subdivision as another 5 waves in lesser degree. Down from wave ((ii)), wave (i) ended at 1.0846, and wave (ii) ended at 1.0866.
Wave (iii) lower ended at 1.071 and the rally in wave (iv) ended at 1.0756. Final wave (v) lower ended at 1.06 which completed wave ((iii)). Wave ((iv)) rally is unfolding as an expanded Flat structure. Up from wave ((iii)), wave (a) ended at 1.065, and dips in wave (b) ended at 1.06. Wave (c) higher ended at 1.069 which completed wave ((iv)). Pair then extends lower again in wave ((v)). While below 1.069, expect the pair to extend lower in wave ((v)) to complete wave C of (2) before the pair turns higher.
EURUSD 60 Minutes Elliott Wave Chart
EURUSD Elliott Wave Video
Video Length: 00:04:30
More By This Author:
Elliott Wave Theory Suggests EURJPY Remains BullishONEOK Inc Should Remain Supported In Bullish Sequence
Silver Miners ETF Has Turned Higher
Disclaimer: Futures, options, and over the counter foreign exchange products may involve substantial risk and may not be suitable for all investors. Leverage can work against you as well as for ...
more


