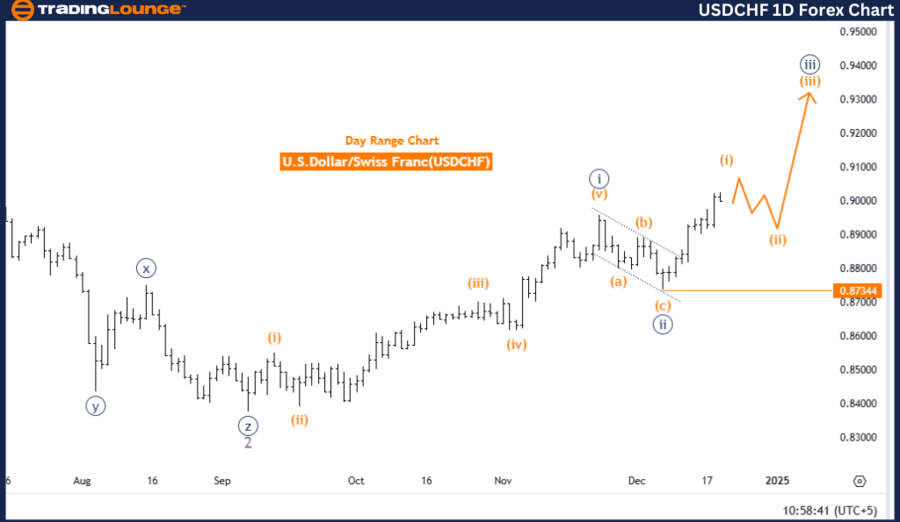
Elliott Wave Technical Analysis: U.S. Dollar/Swiss Franc - Thursday, Dec. 19
U.S. Dollar / Swiss Franc (USDCHF) Day Chart
USDCHF Elliott Wave Technical Analysis
- Function: Bullish Trend
- Mode: Impulsive
- Structure: Orange wave 1
- Position: Navy blue wave 3
- Direction Next Lower Degrees: Orange wave 2
- Details: Orange wave C of 2 appears complete. Now, orange wave 1 of navy blue wave 3 is underway.
- Wave Cancel Invalidation Level: 0.87344
Analysis Summary
The USDCHF daily chart suggests a bullish trend based on the Elliott Wave framework. The current focus lies on an impulsive wave structure, specifically orange wave 1, which is part of the broader navy blue wave 3. This pattern indicates sustained upward momentum aligned with the market’s dominant direction.
Details of Wave Progression
- The analysis highlights the completion of orange wave C, marking the conclusion of the corrective phase within orange wave 2.
- Following this, the market has entered the development of orange wave 1, which signifies the initial phase of impulsive movement within navy blue wave 3.
- This transition reflects a shift from a consolidated phase to a trend-following phase.
Next Phase Outlook
Looking ahead, the next lower degree wave is anticipated to be orange wave 2, a corrective wave that may briefly disrupt the upward trend. However, this wave is expected to provide a strong foundation for the continuation of navy blue wave 3 as the bullish momentum resumes.
Critical Threshold
The wave cancel invalidation level is identified at 0.87344. If the price drops below this level, the current wave count and analysis would be invalid, necessitating a reevaluation of the market structure.
Conclusion
In summary, the USDCHF daily chart reflects a bullish trend, marked by the completion of orange wave C and the initiation of orange wave 1 within navy blue wave 3. This analysis, grounded in Elliott Wave theory, showcases the dynamic interplay between corrective and impulsive phases. The market appears positioned for continued upward movement, with orange wave 2 potentially serving as a brief corrective pause within the broader bullish framework.
This analysis offers valuable insights into the momentum and structural dynamics driving the USDCHF market.
U.S. Dollar / Swiss Franc (USDCHF) 4-Hour Chart
USDCHF Elliott Wave Technical Analysis
- Function: Bullish Trend
- Mode: Impulsive
- Structure: Orange wave 1
- Position: Navy blue wave 3
- Direction Next Lower Degrees: Orange wave 2
- Details: Orange wave C of 2 appears complete. Now, orange wave 1 of navy blue wave 3 is in progress.
- Wave Cancel Invalidation Level: 0.87344
Analysis Overview
The USDCHF 4-hour chart reveals a bullish trend within the Elliott Wave framework. The current structure under observation is orange wave 1, part of an impulsive wave pattern signifying strong upward movement. This wave is positioned within navy blue wave 3, aligning with the continuation of the larger bullish trend.
Wave Progression Details
- Orange wave C of wave 2 has been identified as completed, marking the conclusion of the corrective phase.
- Following this, orange wave 1 of navy blue wave 3 has begun to develop, signaling the initiation of a new impulsive upward phase post-consolidation.
Outlook for Next Lower Degree Movement
The next anticipated movement at a lower degree is orange wave 2, a corrective wave that may temporarily interrupt the upward trend. However, it is expected to provide a strong foundation for the continuation of navy blue wave 3 in alignment with the bullish momentum.
Key Market Dynamics
This analysis underscores the cyclical nature of market behavior:
- Corrective phases, such as orange wave C, are succeeded by impulsive trends like orange wave 1.
- This dynamic reflects the market's alignment with dominant bullish direction.
Conclusion
The USDCHF 4-hour chart illustrates a bullish trend, highlighted by the completion of orange wave C and the active development of orange wave 1 within navy blue wave 3. The anticipated orange wave 2 will play a pivotal role in shaping the subsequent phase of this upward movement.
The wave cancel invalidation level is set at 0.87344, serving as a critical threshold for confirming or reevaluating this analysis. This wave structure affirms the ongoing bullish momentum, consistent with Elliott Wave principles.
Technical Analyst: Malik Awais
More By This Author:
Elliott Wave Technical Analysis: Bitcoin Crypto Price News For Thursday, Dec 19
Fed Rate Cut Triggers Elliott Wave Primary Wave 4: S&P 500, NDX, DAX, FTSE & ASX Outlook
Unlocking ASX Trading Success - Insurance Australia Group Limited
Analyst Peter Mathers TradingLounge™ Australian Financial Services Licence - AFSL 317817


.thumb.png.283b6c202373f2f4be1ce36cba7b8b84.png)


