
USDJPY Elliott Wave Analysis – Trading Lounge
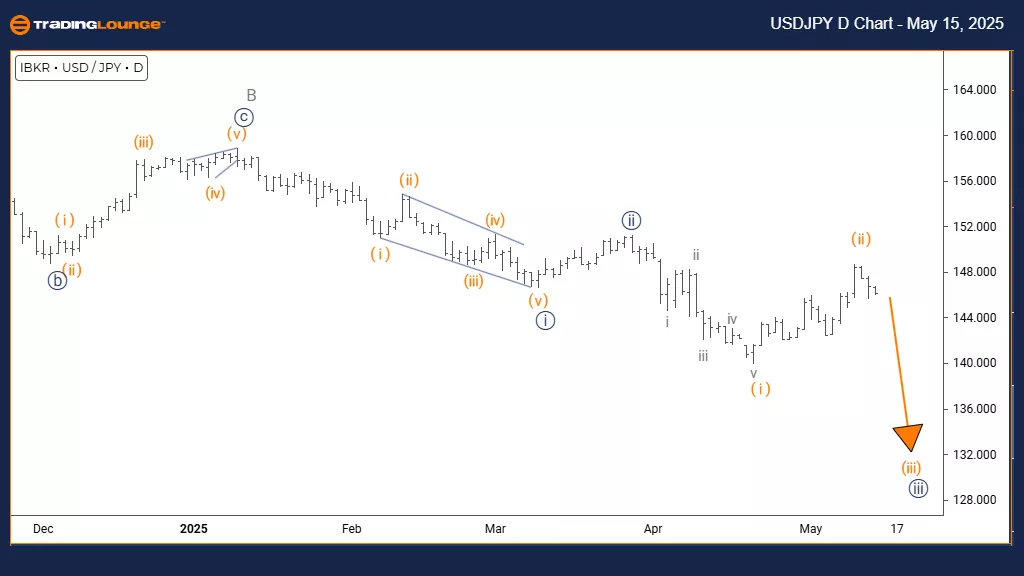
U.S. Dollar / Japanese Yen (USDJPY) Day Chart
USDJPY Elliott Wave Technical Analysis
FUNCTION: Counter Trend
MODE: Impulsive
STRUCTURE: Navy Blue Wave 3
POSITION: Gray Wave C
DIRECTION NEXT HIGHER DEGREES: Navy Blue Wave 4
DETAILS:
Navy Blue Wave 2 appears complete, and Navy Blue Wave 3 is currently underway.
The daily chart highlights a counter-trend setup for USDJPY. This setup showcases impulsive wave behavior within a broader corrective structure. Based on the current wave count, the pair is forming Navy Blue Wave 3 inside Gray Wave C, indicating the last downward move of a larger correction.
The analysis supports the completion of Navy Blue Wave 2, confirming the start of Navy Blue Wave 3. This wave is developing with impulsive characteristics, pointing to strong downward momentum in this phase of the market structure.
As the pattern progresses, the next movement expected in the wave sequence is Navy Blue Wave 4. This will likely act as a corrective move following the completion of Wave 3’s decline. The end of Navy Blue Wave 2 signals the market's transition, and the impulsive move suggests the possibility of further downside before the wave exhausts.
Given the counter-trend nature of the movement, this current drop should be viewed as part of a corrective pattern rather than a beginning of a bearish trend. Traders should stay alert for signs that Wave 3 is ending, as it may offer reversal opportunities when Wave 4 starts. This analysis provides key insight into the pair’s placement in the larger cycle and helps identify potential inflection points.
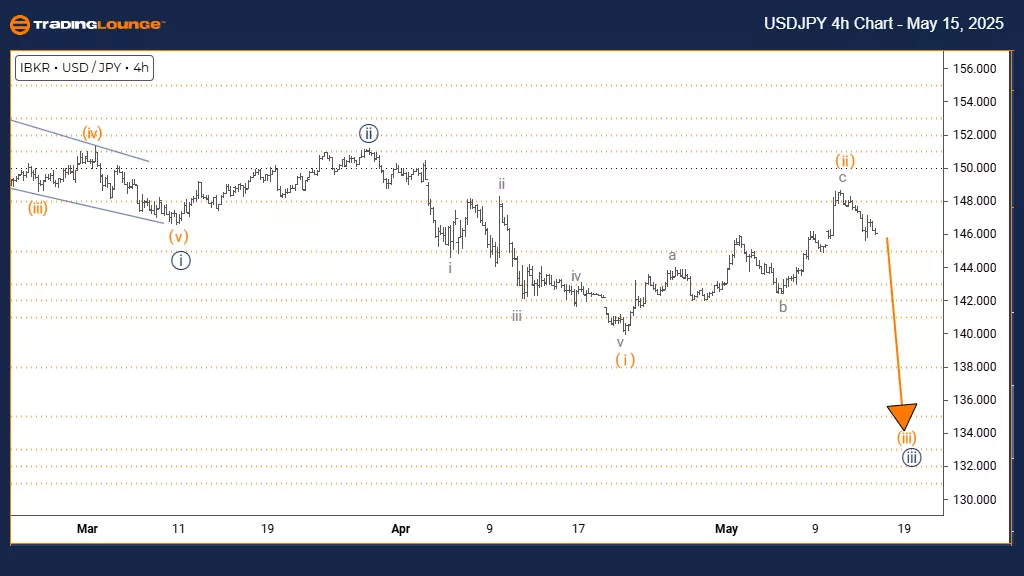
U.S. Dollar / Japanese Yen (USDJPY) 4 Hour Chart
USDJPY Elliott Wave Technical Analysis
FUNCTION: Bearish Trend
MODE: Impulsive
STRUCTURE: Orange Wave 3
POSITION: Navy Blue Wave 3
DIRECTION NEXT LOWER DEGREES: Orange Wave 3 (started)
DETAILS:
Orange Wave 2 appears complete, and Orange Wave 3 is currently in motion.
The 4-hour USDJPY chart outlines a bearish trend with evident downward force, supported by an impulsive wave pattern. According to the analysis, Orange Wave 3 is progressing within the broader Navy Blue Wave 3. This implies that the correction phase of Orange Wave 2 has concluded and the market has now shifted into a stronger bearish phase.
This type of wave structure is often the most forceful within a bearish Elliott sequence, typically marked by significant price moves and higher volatility. The confirmed transition from Orange Wave 2 to Orange Wave 3 indicates active selling in the market.
The impulsive traits of this wave suggest firm downside momentum, with its placement inside Navy Blue Wave 3 hinting at more room for decline. This stage may represent the beginning of a faster and deeper move downward before any potential corrective phase appears.
For traders, this chart pattern offers a framework for assessing short entries while managing exposure carefully. Given that Orange Wave 3 is often the strongest part of a trend, the pair might continue falling sharply. Monitoring the chart for bearish confirmations or early signs of wave exhaustion remains essential. This analysis also aids in planning position sizes and managing risk effectively in the ongoing downtrend.
Technical Analyst: Malik Awais
More By This Author:
Elliott Wave Technical Analysis: Ripple Crypto Price News For Thursday, May15
Technical Analysis: S&P 500, Nasdaq, DAX 40, FTSE 100, ASX 200
Elliott Wave Technical Forecast Newmont Corporation


Comments
Log in or sign up to join the conversation.