
EURGBP Elliott Wave Analysis | Trading Lounge Daily Chart
Euro / British Pound (EURGBP)
EURGBP Elliott Wave Technical Analysis
- Function: Counter Trend
- Mode: Corrective
- Structure: Gray Wave C
- Position: Orange Wave Y
- Direction Next Lower Degrees: Gray Wave C (in progress)
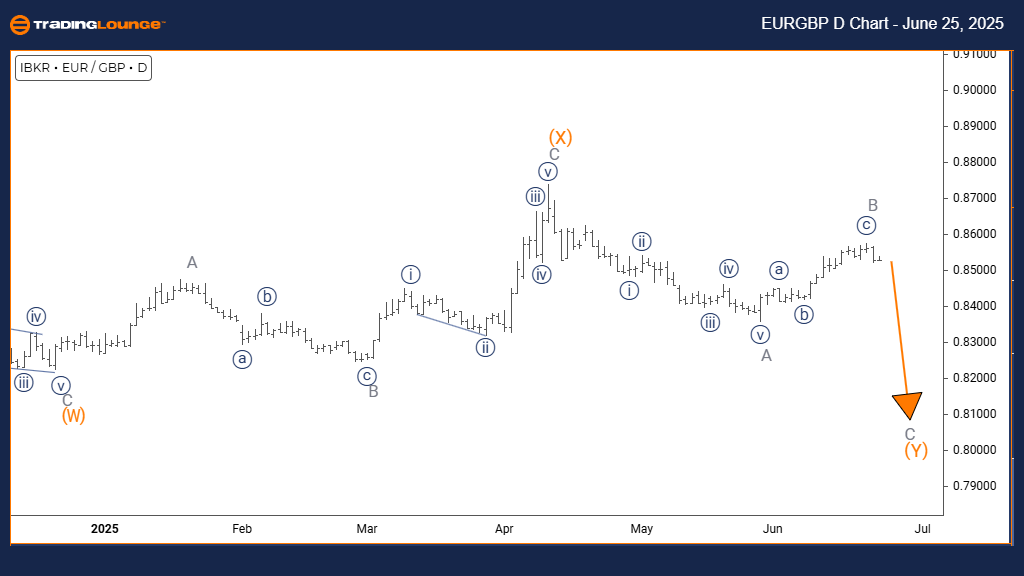
- Details: Gray Wave B appears complete; Gray Wave C is now underway.
Wave Structure Overview
The EURGBP daily chart shows a counter-trend setup within a corrective price phase. The ongoing movement reflects a pullback within a broader trend, with Gray Wave C evolving as part of a larger Orange Wave Y structure. This pattern suggests a temporary retracement is unfolding before a possible continuation in the primary direction.
Corrective Development
Gray Wave B seems to have concluded, signaling the start of Gray Wave C. This phase is a classic corrective movement that generally pulls back a portion of Wave B’s gains. Following this, Gray Wave C may potentially transition into the next directional phase.
Market Implications
As EURGBP moves through Gray Wave C, some range-bound price action or minor pullbacks are expected. Given its position within Orange Wave Y, this action fits within a broader corrective pattern. Traders should watch for signs of Wave C completion, indicating readiness for a new trend leg.
EURGBP Elliott Wave Analysis | Trading Lounge 4-Hour Chart
Euro / British Pound (EURGBP)
EURGBP Elliott Wave Technical Analysis
- Function: Counter Trend
- Mode: Corrective
- Structure: Gray Wave C
- Position: Orange Wave Y
- Direction Next Lower Degrees: Gray Wave C (active)
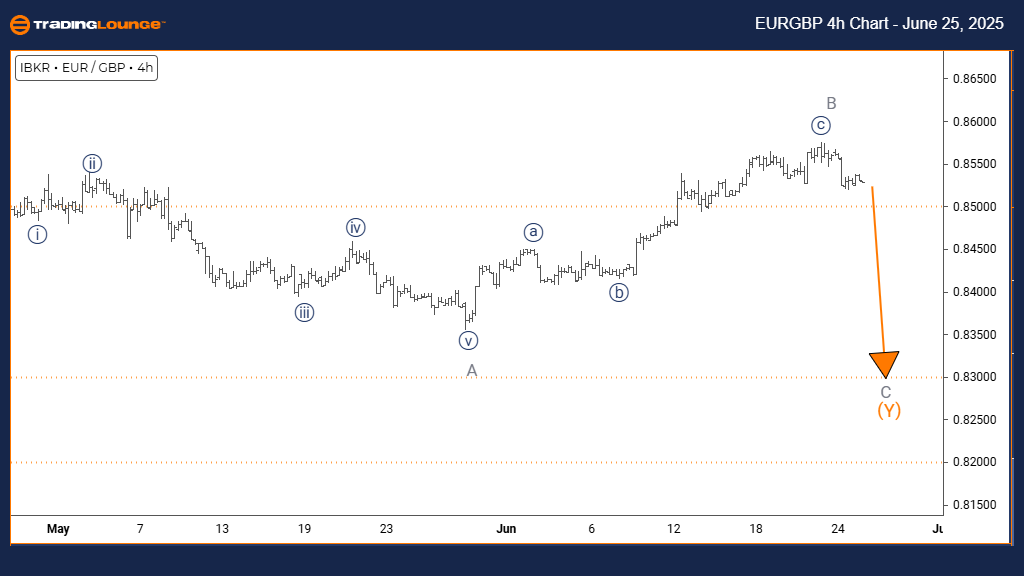
- Details: Gray Wave B appears to be complete; Gray Wave C is developing.
Wave Structure Overview
On the 4-hour chart, EURGBP continues within a corrective pattern identified as Gray Wave C. The pair is pulling back within Orange Wave Y, aligning with typical counter-trend behavior. This setup suggests a temporary phase of consolidation before a return to the main trend.
Outlook and Strategy
Gray Wave B’s conclusion transitions the chart into Gray Wave C. This indicates that the pair may experience moderate pullbacks or sideways movement before progressing further. Completion signals from Gray Wave C will be key in identifying the next move in EURGBP price action.
Technical Analyst: Malik Awais
More By This Author:
Elliott Wave Technical Analysis: Ethereum Crypto Price News For Wednesday, June 25
Unlocking ASX Trading Success: Northern Star Resources Ltd - Tuesday, June 24
Elliott Wave Technical Analysis PepsiCo Inc.


Comments
Log in or sign up to join the conversation.