Elliott Wave Indicates Bearish Sequence For GBPJPY, Favoring A Downward Trajectory
Image Source: Unsplash
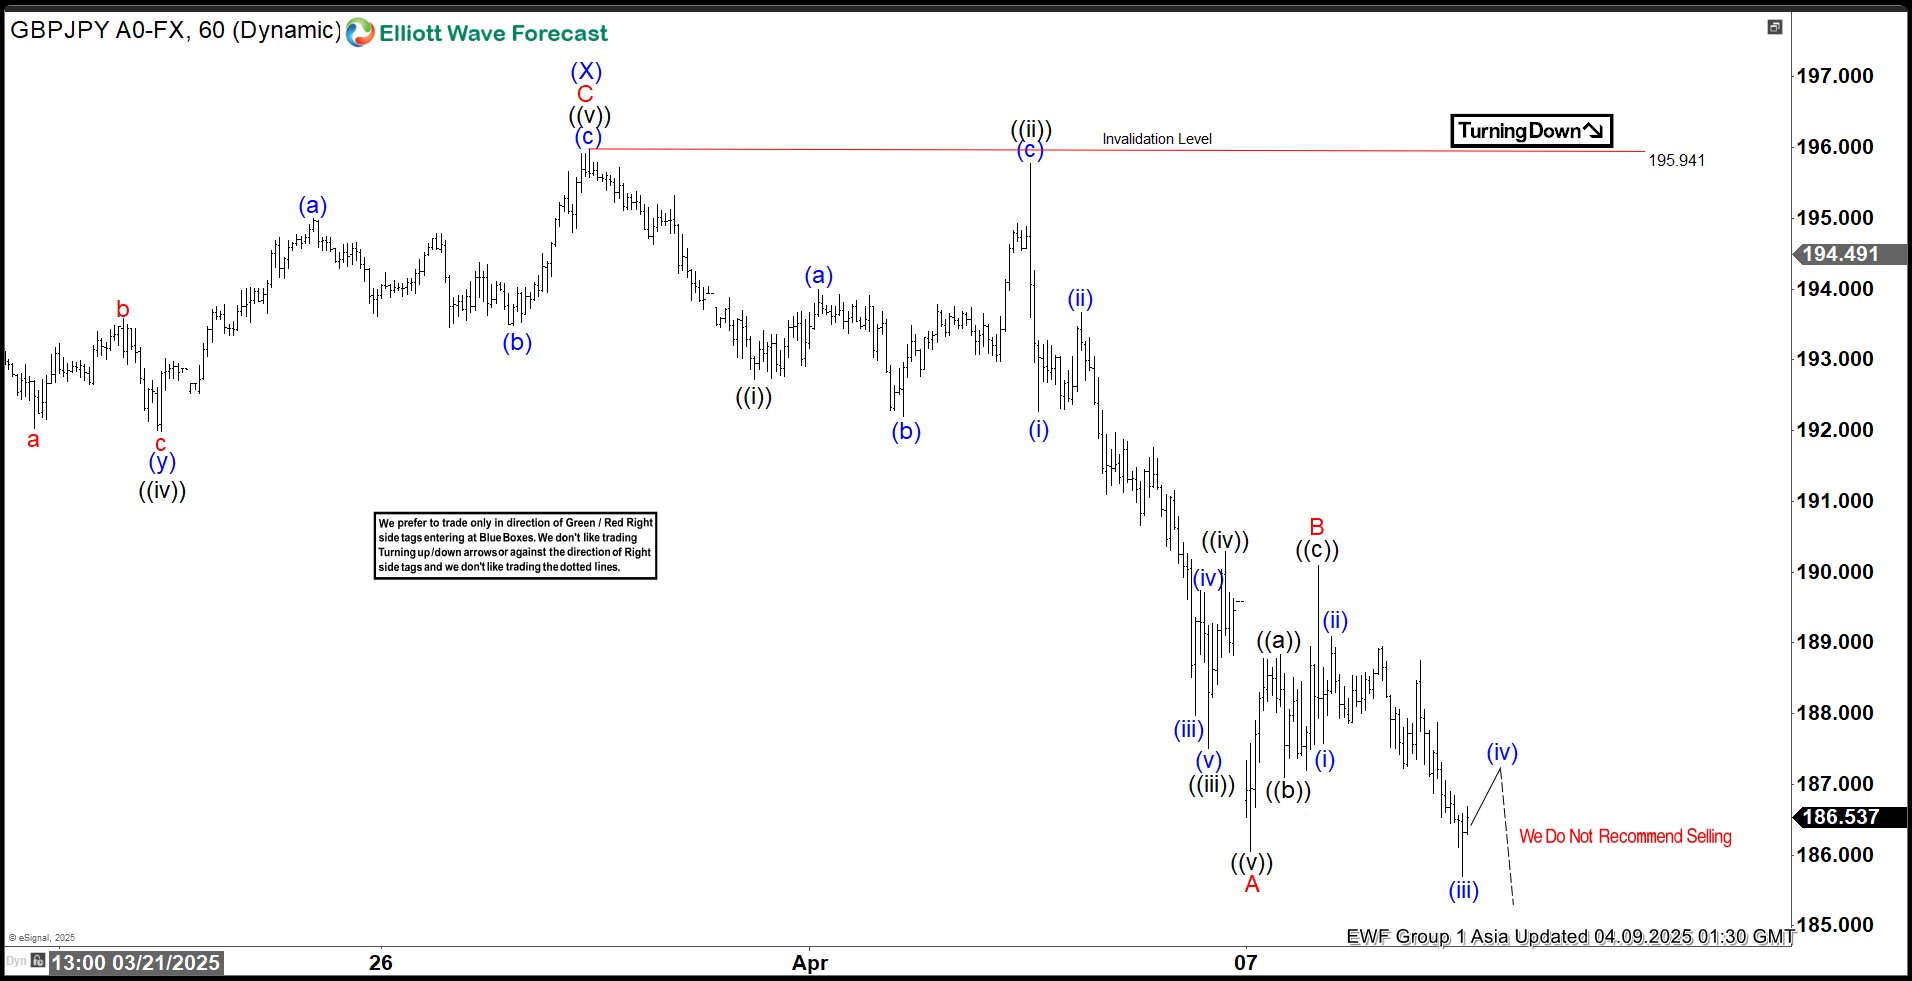
The Elliott Wave perspective indicates that GBPJPY has entered a bearish sequence from its October 30, 2024 high. It signals further downside potential. From that peak, wave (W) concluded at 187.05, followed by a wave (X) rally that terminated at 195.94, as illustrated in the accompanying 1-hour chart. Currently, wave (Y) is unfolding lower, exhibiting an internal zigzag structure.
Breaking it down from the wave (X) high, wave ((i)) declined to 192.7. The subsequent wave ((ii)) rally peaked at 195.77. The pair then resumed its descent in wave ((iii)), reaching 187.51, before a wave ((iv)) bounce concluded at 190.29. The final leg, wave ((v)), completed at 186.05, marking the end of wave A in a higher degree. From there, wave B unfolded as a zigzag corrective pattern: wave ((a)) rose to 188.83, and wave ((b)) pulled back to 187.09. Wave ((c)) advanced to 190.08, completing wave B. The pair has since resumed its decline in wave C.
In the near term, as long as the pivotal high at 195.94 remains intact, any rallies are expected to falter in a 3, 7, or 11 swing structure, reinforcing the outlook for further downside. Traders monitoring this setup should anticipate limited upside and watch for confirmation of this bearish continuation.
GBPJPY 60 Minute Elliott Wave Chart
GBPJPY Video
Video Length: 00:03:38
More By This Author:
Light Crude Oil Is Targeting Further Declines In The Near TermSPX Elliott Wave : Incomplete Sequences Calling The Decline
Apple Gains Momentum With 5 Swing Rally, Upside Likely
Disclaimer: Futures, options, and over the counter foreign exchange products may involve substantial risk and may not be suitable for all investors. Leverage can work against you as well as for ...
more


