
Elliott Wave Analysis: USD/CHF And USD/JPY Look For Pullback Before Turning Higher

Photo by Claudio Schwarz on Unsplash
Stocks are higher and the USD turning down despite the hawkish Fed with an increase its policy rate by 25 basis points. We see the USD index turning down, so it might have been a buy the rumor sell the news impact about what we talked about in our past updates.
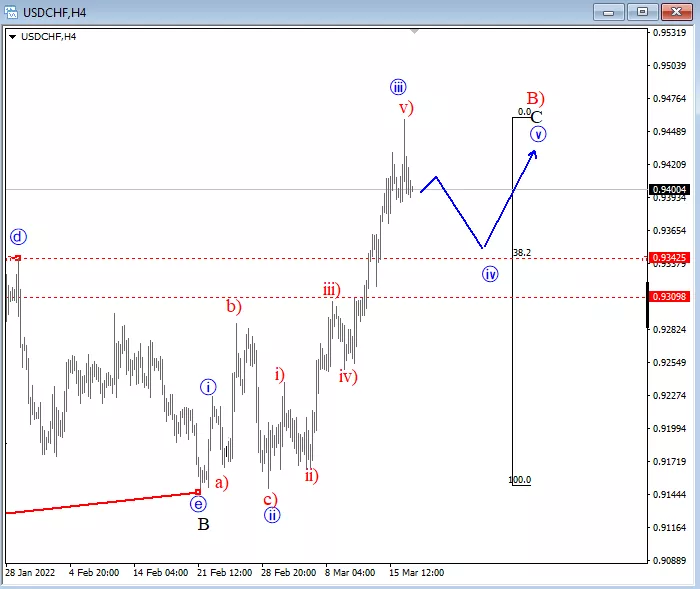
USD/CHF stabilized at the lower side of a big triangle range back in February and is currently turning higher, breaking resistance levels, so it appears that wave C of B) is still in play possibly to 0.950 area which can be seen after sub-wave four pullbacks when looking at 4h chart. Support is at a former high, and at 38.2%, near 0.93-0.9340.
USD/CHF Elliott Wave Analysis
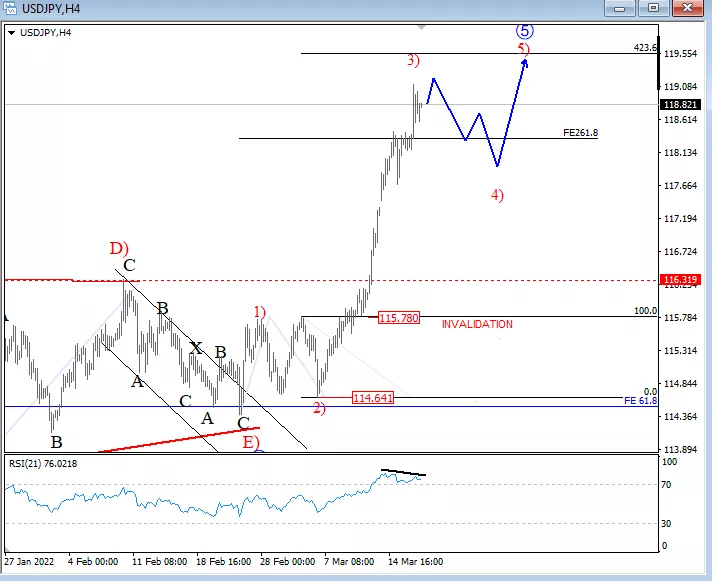
USD/JPY is coming higher as expected, now breaking out of a triangle, meaning that the pair can be in the final piece of a higher degree impulse from 2021 swing lows. We see this as a fifth wave meaning that upside can be limited in upcoming weeks, but based on Fib projections there is still room for 119.00/50 area after pullbacks. Ideally, the next pullback will be wave 4) as we see wave 3) now as a very strong and extended leg, so the market may slow down a bit in the near term.
USD/JPY Elliott Wave Analysis
Disclosure: Please be informed that information we provide is NOT a trading recommendation or investment advice. All of our work is for educational purposes only.


