
(Click on image to enlarge)
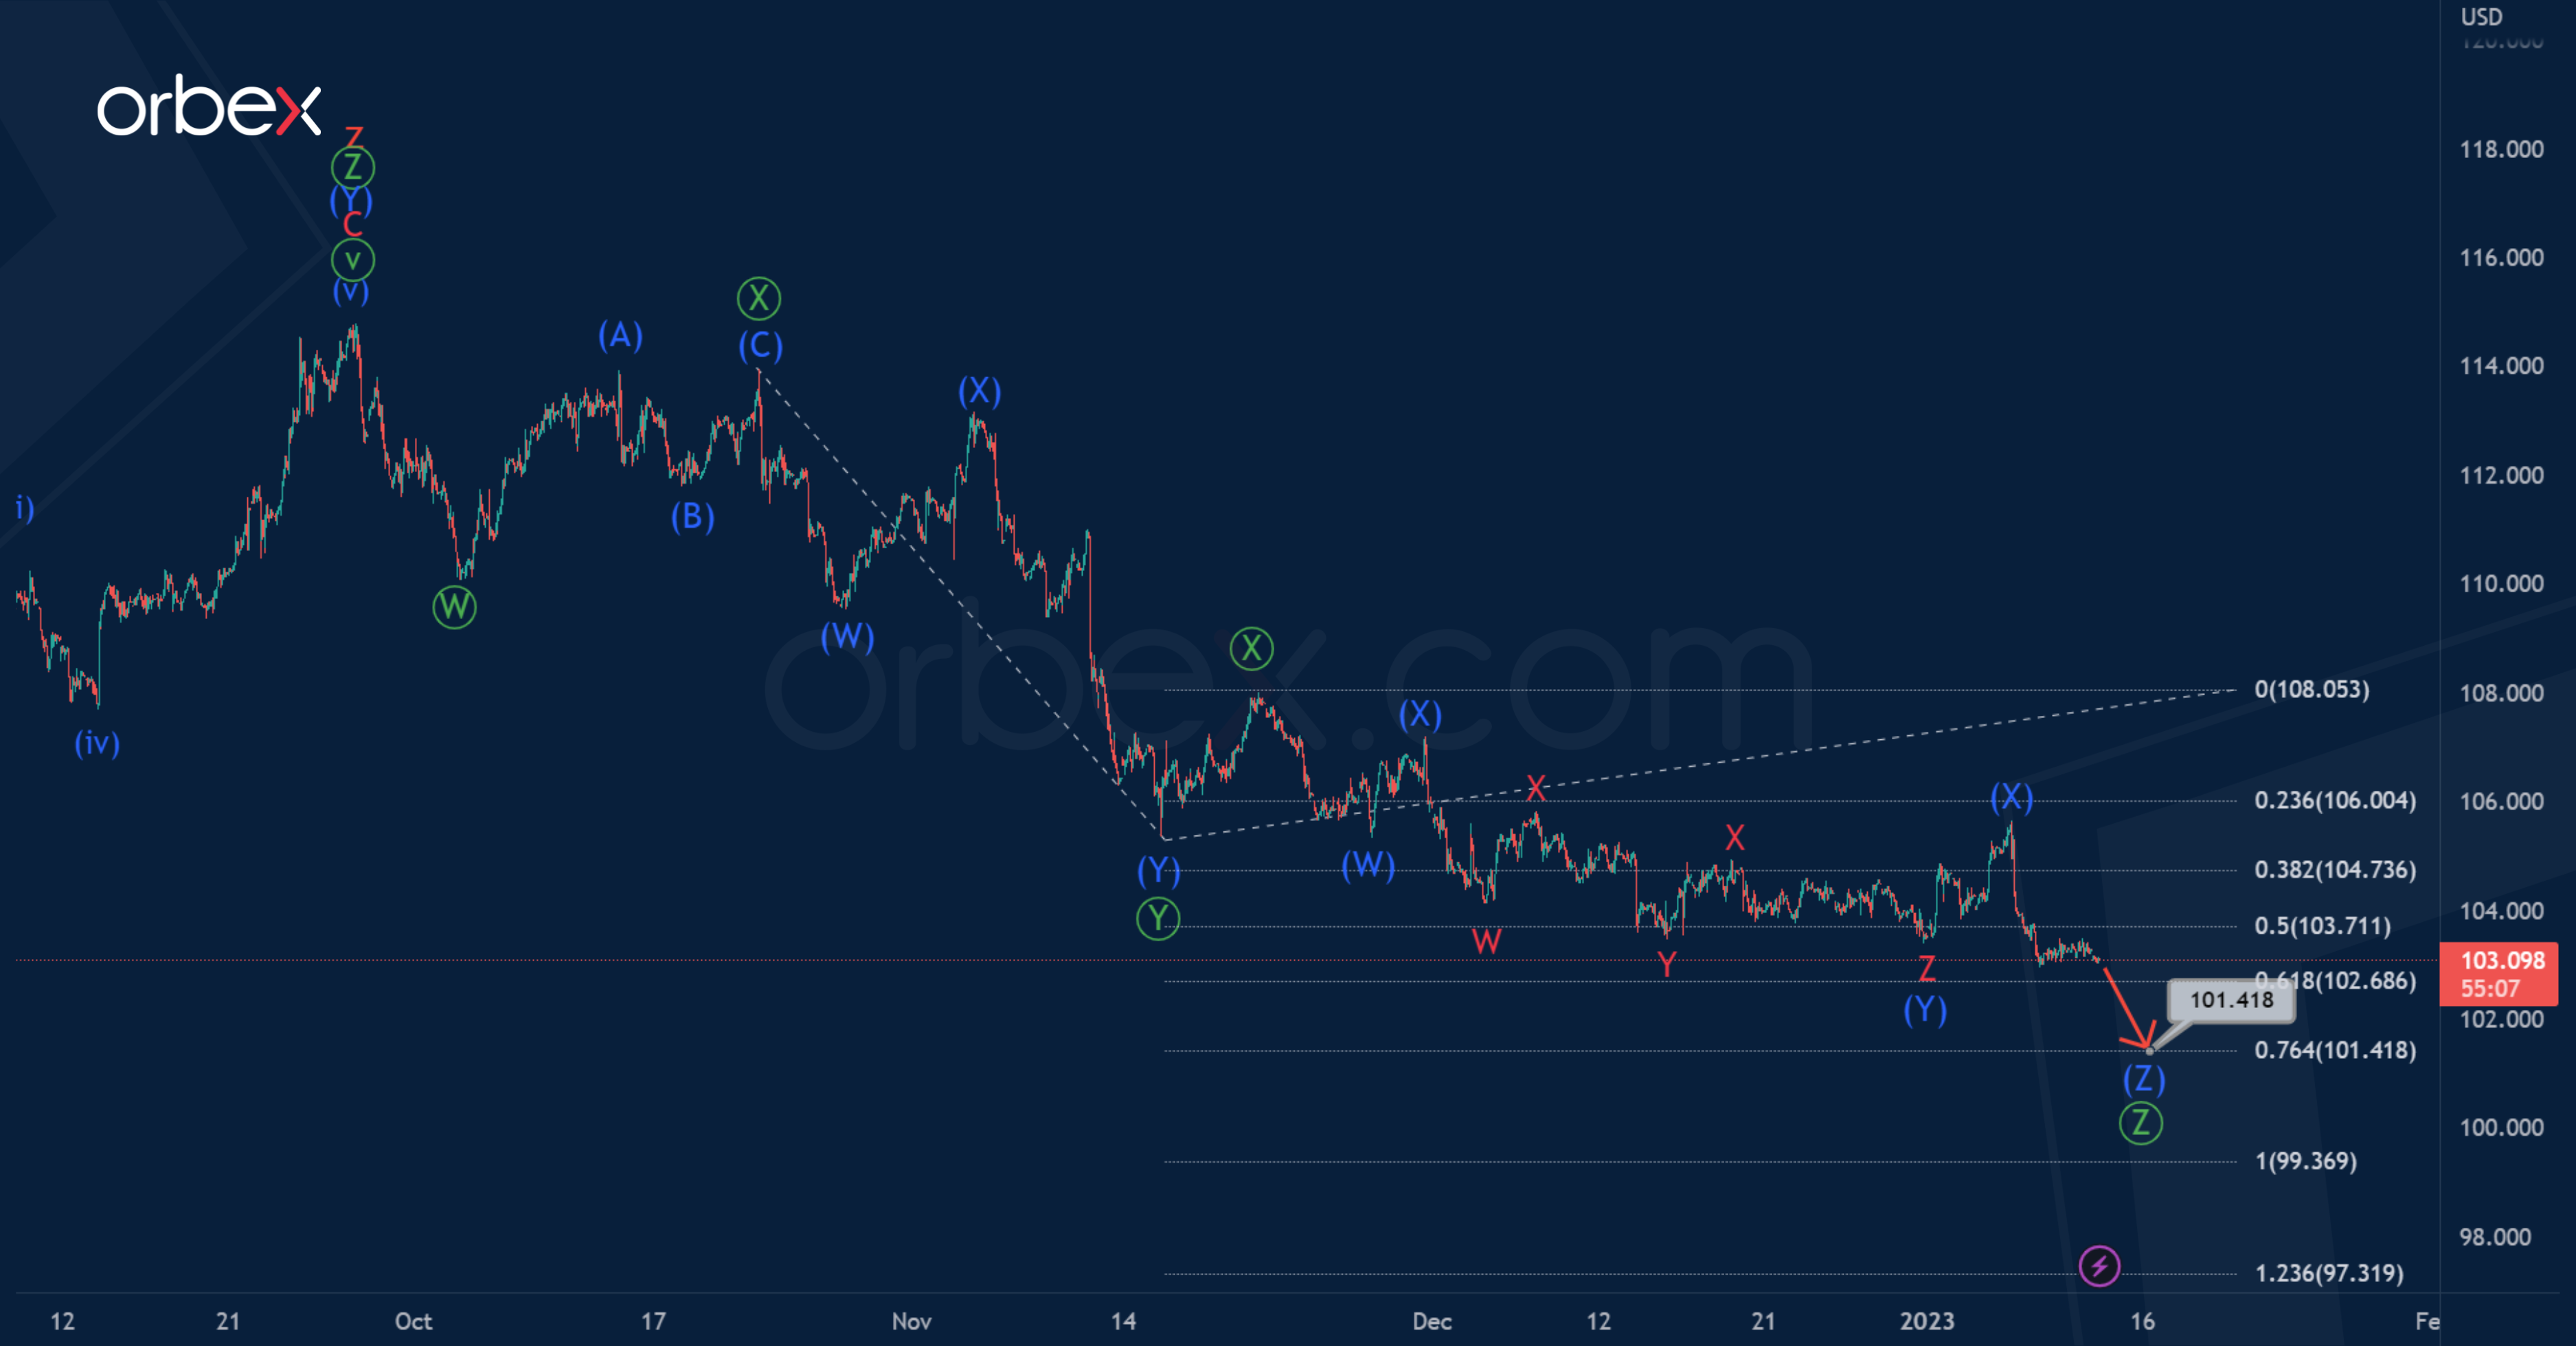
The DXY index chart shows the end of the global corrective trend. This took the form of a triple zigzag consisting of cycle waves w-x-y-x-z.
Prices have now formed a bearish triple Ⓦ-Ⓧ-Ⓨ-Ⓧ-Ⓩ zigzag pattern.
It seems that the sub-waves Ⓦ-Ⓧ-Ⓨ-Ⓧ have ended. In the near future, the price is expected to continue falling in the primary wave Ⓩ. Its end is possible near 101.41. At that level, it will be at 76.4% of wave Ⓨ. The wave Ⓩ itself is also similar to an intermediate triple zigzag.
(Click on image to enlarge)
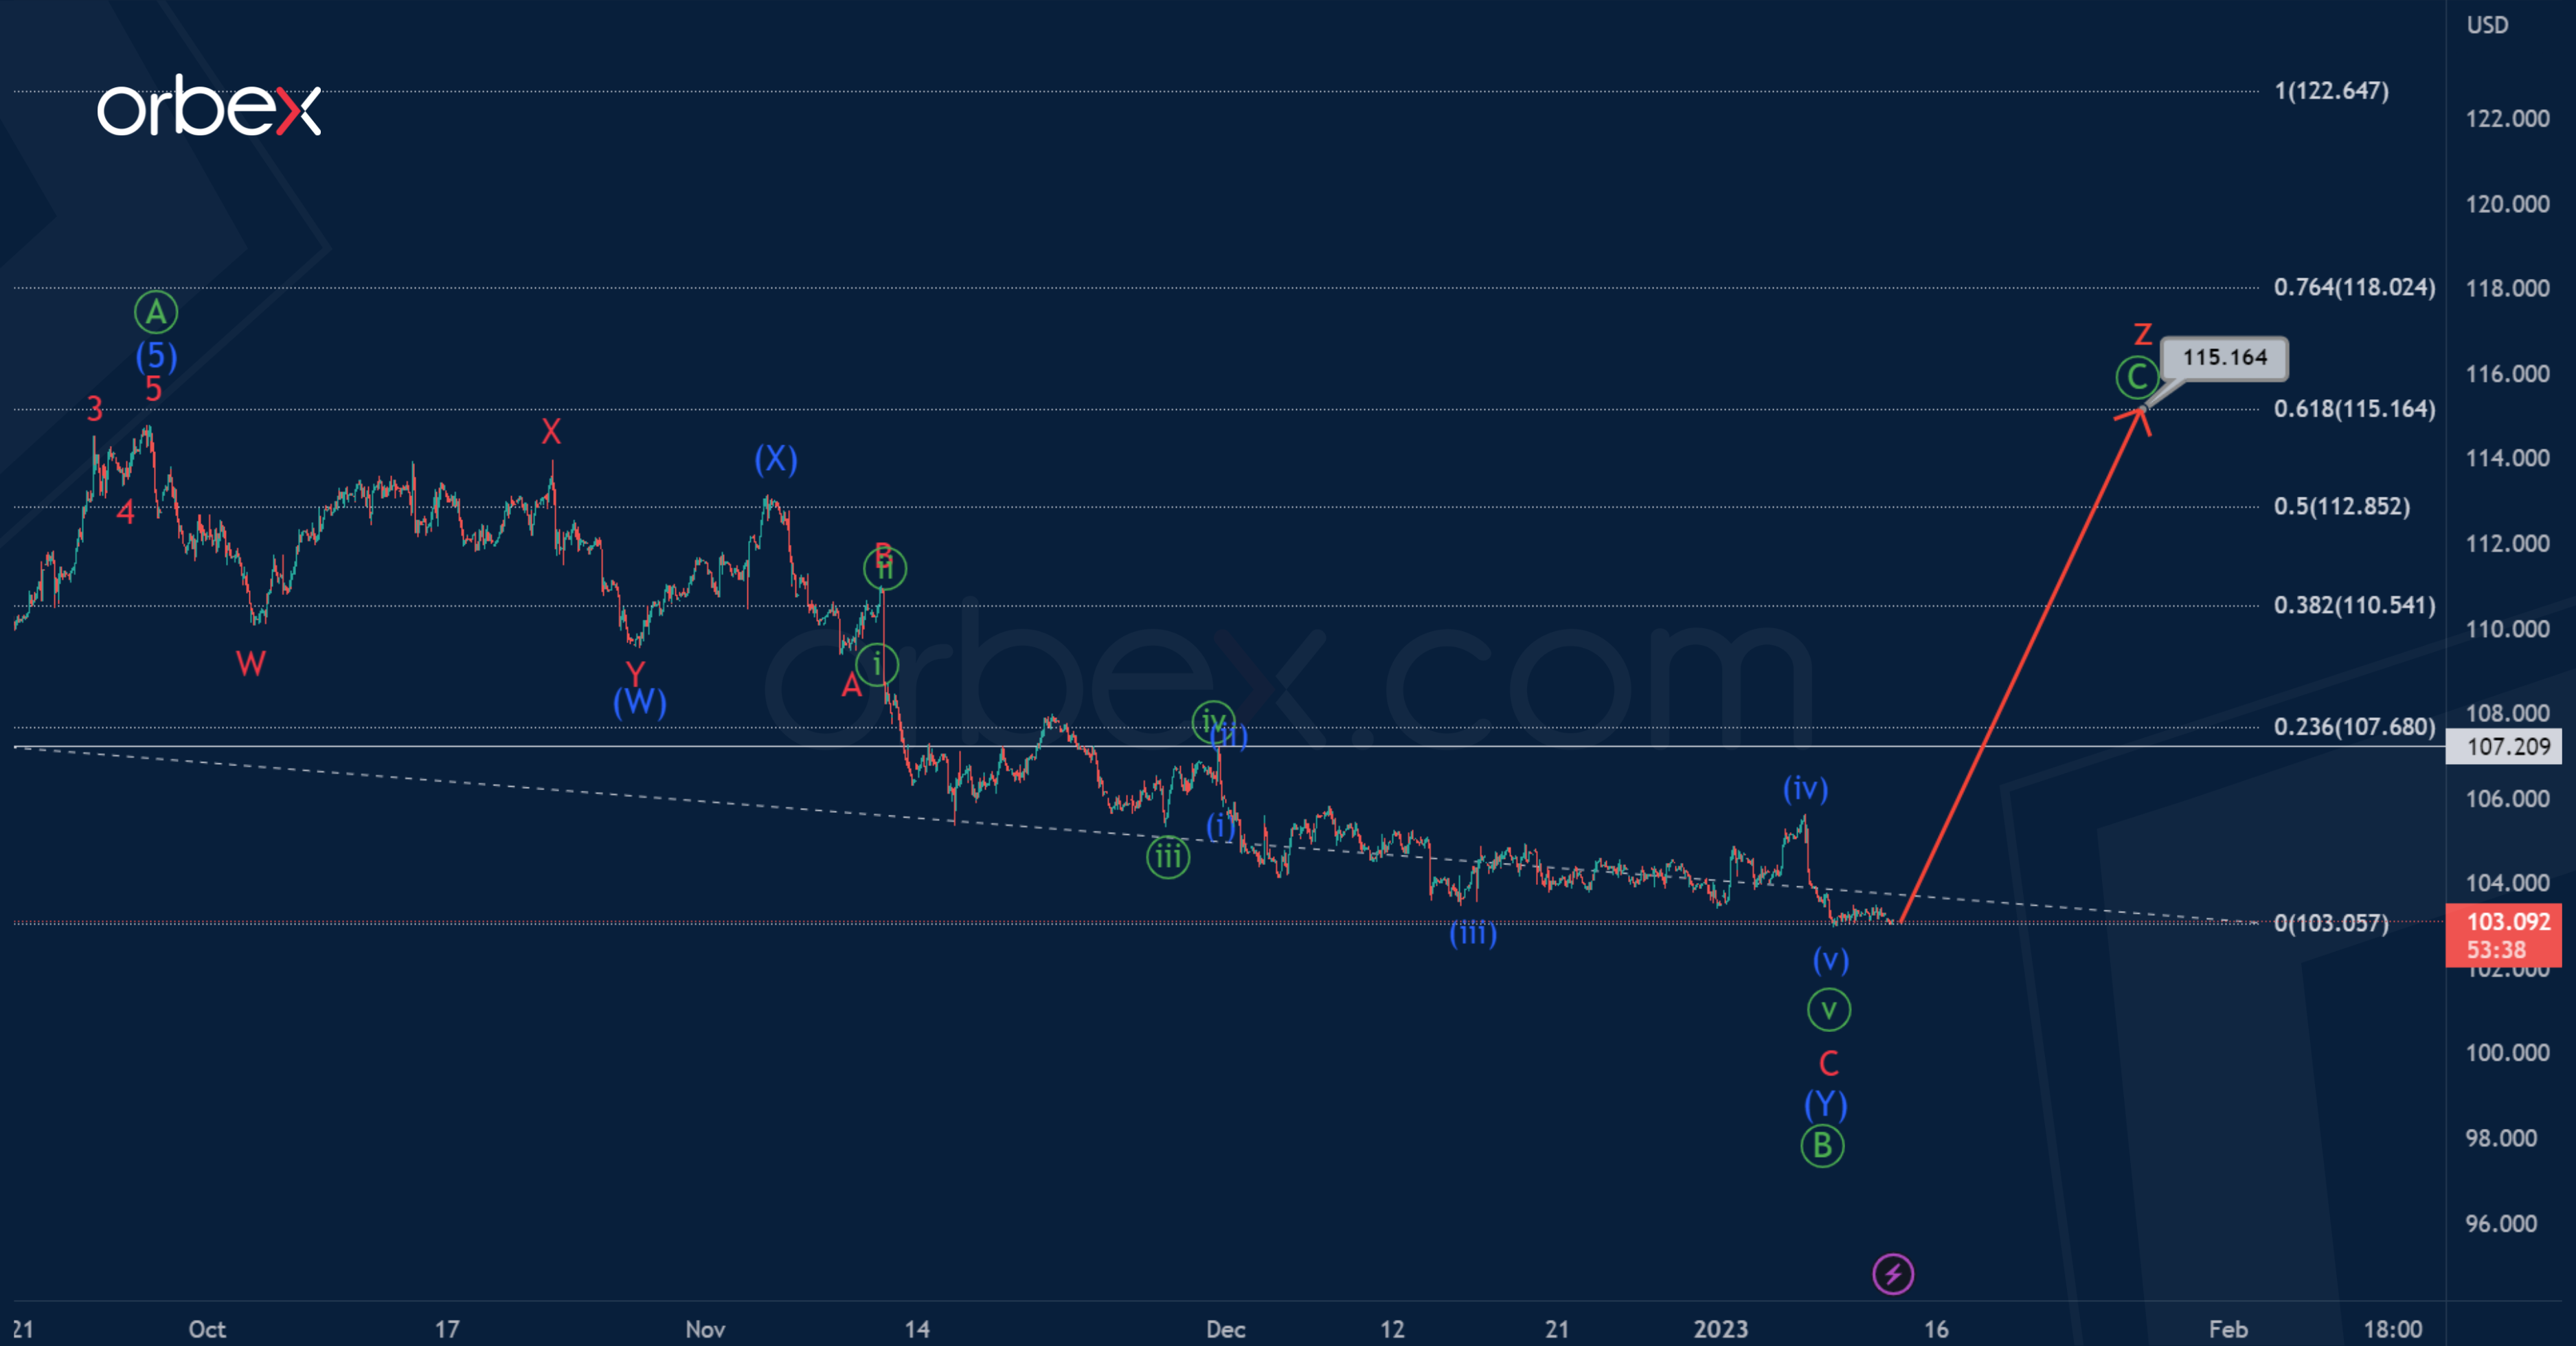
Let’s consider an alternative scenario in which the formation of a cycle triple zigzag will continue.
The wave z could take the form of a zigzag Ⓐ-Ⓑ-Ⓒ. The first impulse Ⓐ and the correction wave Ⓑ in the form of an intermediate double zigzag have ended. The entire wave z can complete its pattern near 115.16. At that level, it will be at the 61.8% Fibonacci extension of wave y.
The first target is located at the previous high of 107.20, where a small fourth correction of the minute degree was marked.
More By This Author:
Why Dollar Traders Should Care About US Bank Earnings
AUDUSD Bearish Triple Zigzag Underway
Intraday Market Analysis – GBP Bounces Back, Wednesday, Jan.11


Comments
Log in or sign up to join the conversation.