
DOW Rallies At The Beginning Of The End!
EURUSD
30 min

4 Hours

Daily

My Bias: short in wave 3 blue.
Wave Structure: downward impulse wave 1, 2 blue
Long term wave count: lower in wave 3 blue
Important risk events: EUR: Spanish Unemployment Change. USD: Average Hourly Earnings m/m, Non-Farm Employment Change, Unemployment Rate.
Buenas noches amigos!
Hope you survived the day in good shape.
EURUSD continues to show signs of a typical topping formation.
After an explosive few months to the upside, we now have come to a complete stall.
The momentum indicators on the daily chart have now diverged form the price action.
The RSI is closing in on a downside cross and MACD has completely flatlined.
The daily chart tells me the good times are over.
The short term wave count is still on slightly shaky grounds.
The three wave rise in wave 'ii' pink has so far proved correct.
The price low of the day overlapped Tuesdays high at 1.1205.
This action adds weight to the bearish count.
1.1256 is now the critical high in the short term wave count.
And an impulsive break of the low at 1.1106 will confirm that wave 'iii' pink has begun
The shift in the daily momentum indicators signifies that this juggernaut is turning to the downside again.
Take note and be ready.
GBPUSD
30 min

4 Hours

Daily
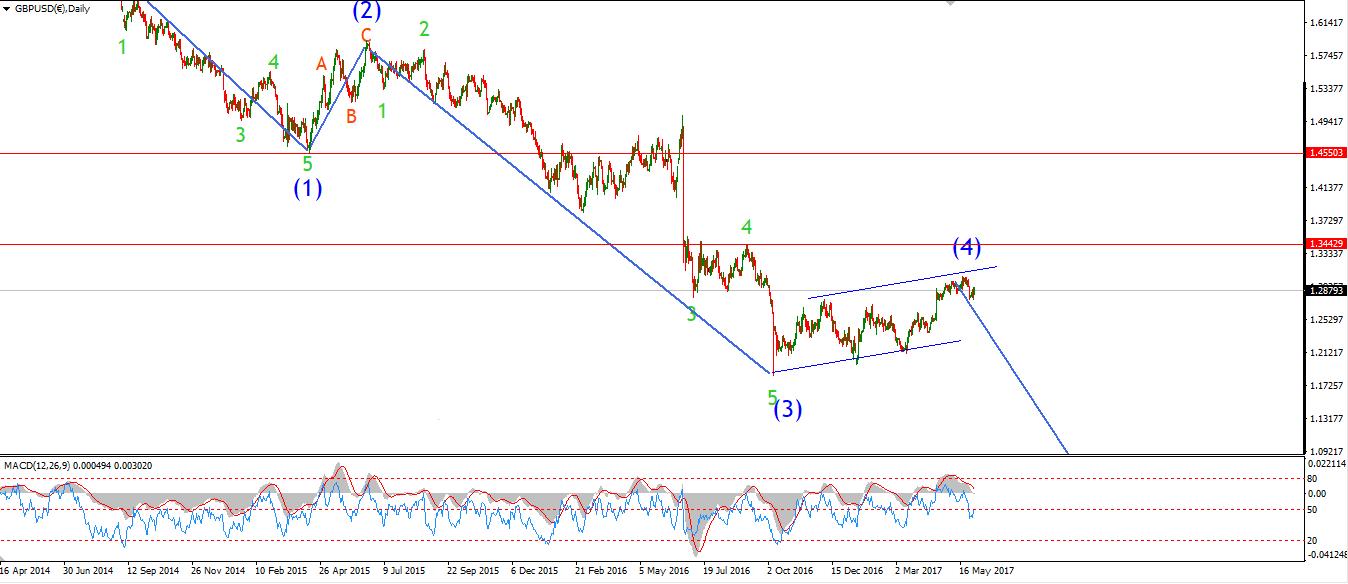
My Bias: short below parity.
Wave Structure: continuing impulsive structure to the downside in wave (5)
Long term wave count: decline in wave (5) blue, below parity
Important risk events: GBP: Construction PMI, USD: Average Hourly Earnings m/m, Non-Farm Employment Change, Unemployment Rate.
I have altered the short term wave count to show a developing impulsive structure to the downside at three degrees of trend so far.
The potential for a collapse in the short term is high at the moment.
A break of support at 1.2774, could cause a cascading decline scenario.
the first hint of the decline will come with a break of 1.2829, todays low.
Take not that the daily momentum situation is far more advanced in cable than EURUSD.
RSI has already given a sell signal,
MACD has turned down and is on the verge of a downside cross.
This is getting very interesting right now.
USDJPY
30 min

4 Hours

Daily
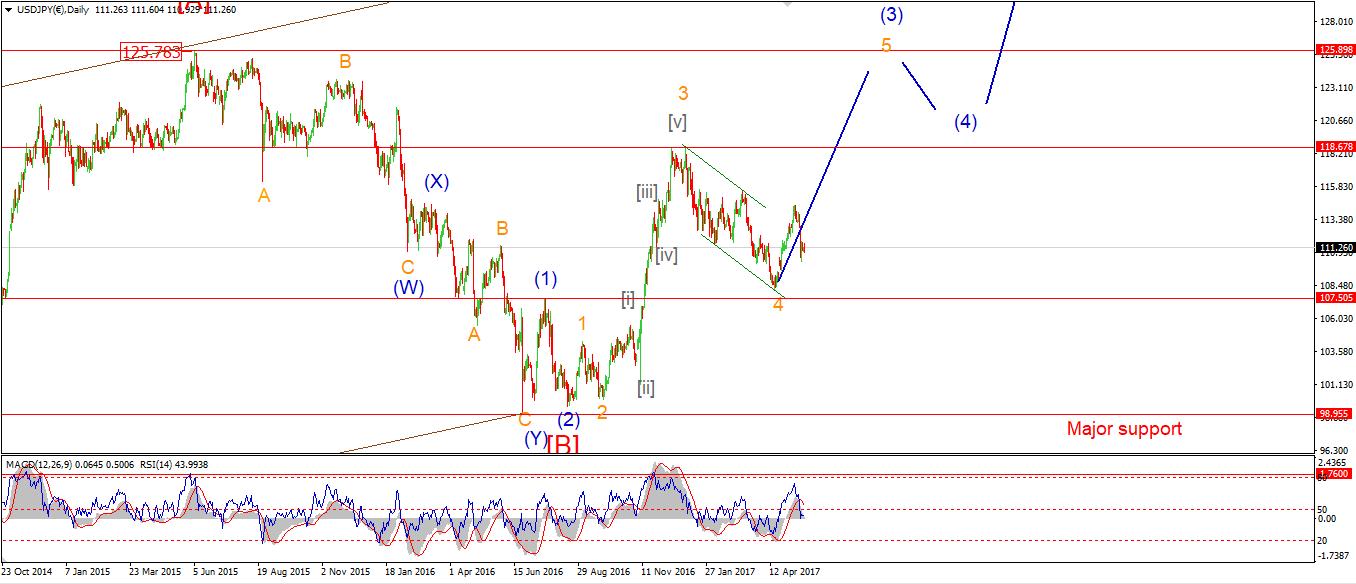
My Bias: LONG
Wave Structure: rally in wave [C]
Long term wave count: wave [C] is underway, upside to above 136.00
Important risk events: JPY: N/A. USD: Average Hourly Earnings m/m, Non-Farm Employment Change, Unemployment Rate.
USDJPY rallied today in an impulsive fashion.
The price has reached the first confirmation point at 111.46.
The price has begun to contract this evening in a possible minor triangle formation.
The price should rally once more to complete wave '1' pink.
Once wave '1' completes wave '2' should correct in three waves, The low of that possible triangle at about 111.00 will form support.
A break of resistance at 112.13 will confirm the beginning of wave 'iii' brown.
Todays rise brought another bullish momentum signal on the 4hr chart.
all the signs of a turn up are lining up nicely here.
DOW JONES INDUSTRIALS
30 min

4 Hours

Daily
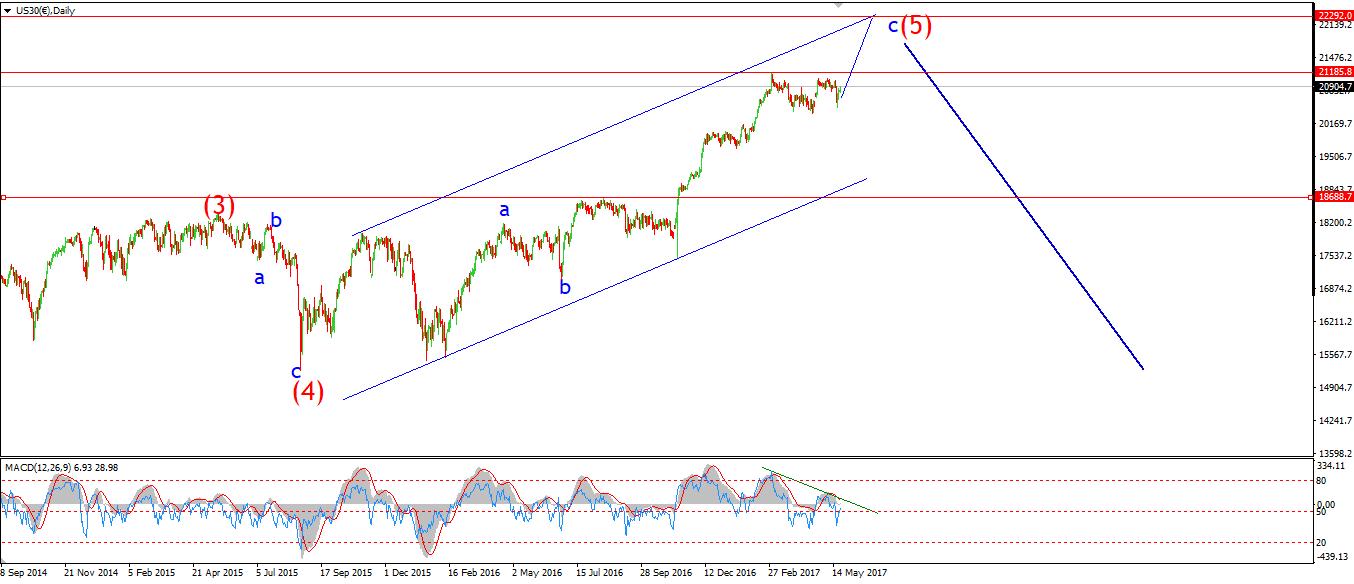
My Bias: market topping process ongoing
Wave Structure: Impulsive 5 wave structure, possibly topping in an all time high.
Long term wave count: Topping in wave (5)
Important risk events: USD: Average Hourly Earnings m/m, Non-Farm Employment Change, Unemployment Rate.
The DOW rallied as expected today.
This action seems to confirm the idea of the beginning a large rally within wave 'iii' pink.
The obvious first major resistance lies at the all time high of 21171.
But I expect that to be broken in short order, and then we can watch the fawning media proclaim the long awaited 'new era' as having arrived!
Oh boy, this will prove to be a big mistake!
Wave '1' blue has yet to trace out five waves up,
So, for tomorrow, watch for a break of resistance,
The Fibonacci extension projects a target for wave '1' blue at 21222.
At that point wave '2' should commence.
GOLD
30 min

4 Hours

Daily
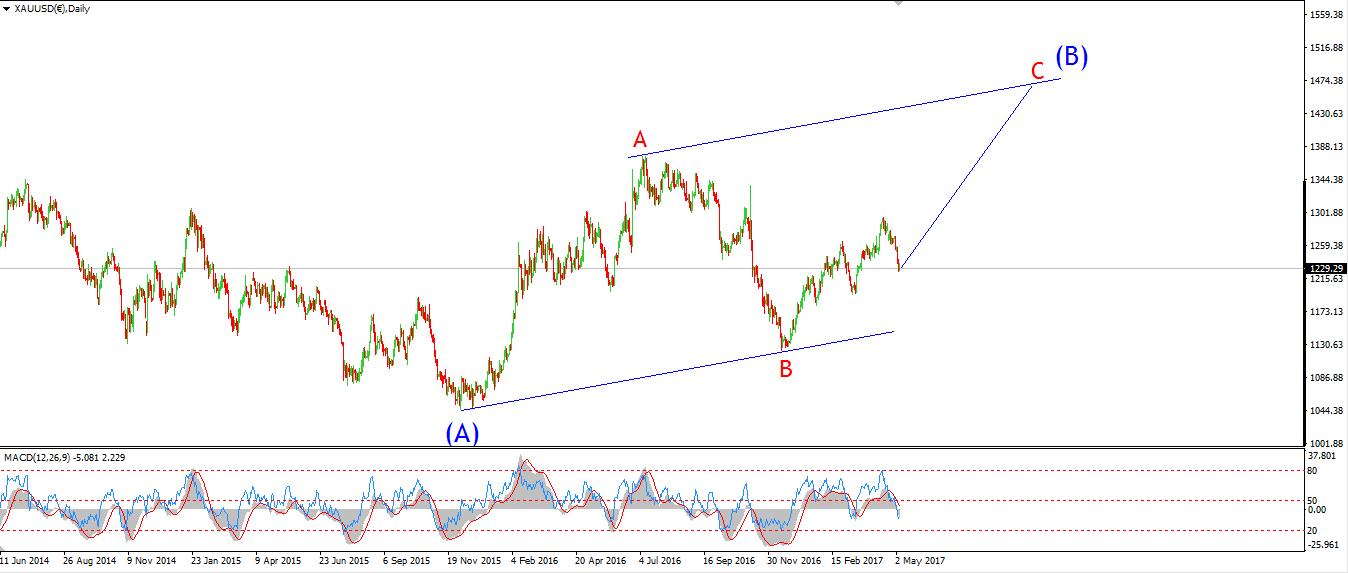
My Bias: Long towards 1550
Wave Structure: ZigZag correction to the upside.
Long term wave count: Topping in wave (B) at 1550
Important risk events: USD: Average Hourly Earnings m/m, Non-Farm Employment Change, Unemployment Rate.
GOLD fell today in a three wave form, which points to a corrective decline.
The bullish picture is intact so far and wave '3' is likely to push prices higher.
The decider for this interpretation lies at 1259.30.
A break to the downside will signal that wave '2' pink is still underway.
And possibly forming an expanded flat.
A break of 1247.83 confirms the alternate wave count shown circled in red.
Either way this correction will end soon enough.
For tomorrow watch for 1259.30 to hold and wave '3' to kick in.
Disclosure: None.


