

Photo by Colin Watts on Unsplash
The GBP/USD has started the new week on the back foot after its big gains recently. It is going to be among the key pairs to watch, owing to the fact we have some important data from the UK – namely, inflation figures on Wednesday that could determine the size of the next Bank of England rate hike. We will also have US retail sales among a handful of macro pointers from the world’s largest economy to impact the cable.
Last week saw the cable advance almost 2%, adding to the 1% or so it had gained in the prior week. Already finding support from a weakening US dollar, the GBP/USD found an additional boost from UK data last week, showing better-than expected wages data and an economy that shrunk in May by 0.1% instead of 0.3% expected by economists.
There’s now some hope that the UK economy may grow modestly in the coming months, finding support from the improving real wages and given that energy bills are slightly lower.
However, higher mortgage rates will hold growth back, which is something that could negatively impact the long-term direction of the GBP/USD and weigh on other pound crosses.
For now, though, the path of least resistance is to the upside for the cable and other pound crosses.
Pound traders’ focus will turn to inflation data come Wednesday after we had a higher-than-expected rise in wages last week. The Bank of England will mostly likely hike rates further at its next meeting on 3rd August. The size of the rate increase could well be determined by the upcoming inflation data.
Key macro highlights for cable this week
Economic calendar this week is not super busy, but does contain a few data releases that could impact the GBP/USD:
|
Date |
Currency |
|
Forecast |
Previous |
|
|
|
|
|
|
|
Mon Jul 17 |
USD |
Empire State Manufacturing Index |
-3.5 |
6.6 |
|
USD |
Core Retail Sales m/m |
0.4% |
0.1% |
|
|
|
USD |
Retail Sales m/m |
0.5% |
0.3% |
|
|
USD |
Industrial Production m/m |
0.0% |
-0.2% |
|
|
USD |
NAHB Housing Market Index |
56 |
55 |
|
|
USD |
TIC Long-Term Purchases |
110.7B |
127.8B |
|
Wed Jul 19 |
GBP |
CPI y/y |
8.2% |
8.7% |
|
|
GBP |
Core CPI y/y |
7.1% |
7.1% |
|
|
GBP |
PPI Input m/m |
-0.2% |
-1.5% |
|
|
GBP |
PPI Output m/m |
-0.3% |
-0.5% |
|
|
GBP |
RPI y/y |
10.9% |
11.3% |
|
|
GBP |
HPI y/y |
3.3% |
3.5% |
|
|
USD |
Building Permits |
1.49M |
1.49M |
|
|
USD |
Housing Starts |
1.48M |
1.63M |
|
|
GBP |
MPC Member Ramsden Speaks |
|
|
|
Thu Jul 20 |
USD |
Unemployment Claims |
242K |
237K |
|
|
USD |
Philly Fed Manufacturing Index |
-10.2 |
-13.7 |
|
|
USD |
Existing Home Sales |
4.22M |
4.30M |
|
|
USD |
CB Leading Index m/m |
-0.6% |
-0.7% |
|
Fri Jul 21 |
GBP |
GfK Consumer Confidence |
-26 |
-24 |
|
|
GBP |
Retail Sales m/m |
0.2% |
0.3% |
|
|
GBP |
Public Sector Net Borrowing |
20.7B |
19.2B |
Among the data highlights, US retail sales and UK CPI are among the data releases that could move the GBP/USD sharply this week. Let’s have a look at those in turn.
US Retail Sales
Tuesday, July 18
13:30 BST
Last week saw both CPI and PPI measures of inflation slow more than expected, raising the possibility that the Fed could pause rate hikes after one final hike in July. If we see retail sales data come in stronger, this will reinforce a goldilocks scenario of slowing prices and a resilient consumer, which should keep the bulls on Wall Street happy. But a weaker print could raise recession fears and undermine investor confidence. Economists expect a 0.5% rise in retail sales on the headline front, and a 0.4% rise in core sales.
UK CPI
Wednesday, July 19
07:00 BST
Pound traders’ focus will turn to inflation data on Wednesday after we had a higher-than-expected rise in wages last week. The Bank of England will mostly likely hike rates further at its next meeting on August 3. The question is whether it will be a 25- or another 50-bps hike. The latest inflation print will have a big say in that. CPI is expected to ease to an 8.2% annual pace from 8.7% previously. After surprising the upside in the last 4 months, will we finally get a downside surprise this time? Core CPI is seen staying unchanged at 7.1% in June, while RPI is seen easing slightly to 10.9% from 11.3% the month before.
GBP/USD Technical analysis
With the GBP/USD holding above both the 21 and 200-day moving averages, both the short- and long-term trends are objectively bullish, especially with the slope of these MAs also being positive. This makes the cable a “buy the dip” market, rather “sell the rip,” at least from a technical standpoint anyway. This means that price is more likely to react to support levels than resistance, as more people would be inclined to look for bullish trades.
However, as per the Relative Strength Index (RSI) sub-index, the cable appears to be ‘overbought’ and so it may need to come down or consolidate for a while before it is ready to go higher again. With the UK CPI not out until Wednesday, a bit of consolidation/pullback should not come as major surprise.
Among the support levels to watch, 1.3000 is now the first line of defense for the bulls. Lose that and a drop to 1.2850 could be on the cards, a level which was previously resistance. We would expect the cable to find good support around that area, if we get there.
On the upside, there are not many obvious resistance levels to watch, so just keep an eye on the round handles like 1.31, 1.32 etc. We will remain a bullish GBP/USD outlook until the charts tell us otherwise.
(Click on image to enlarge)
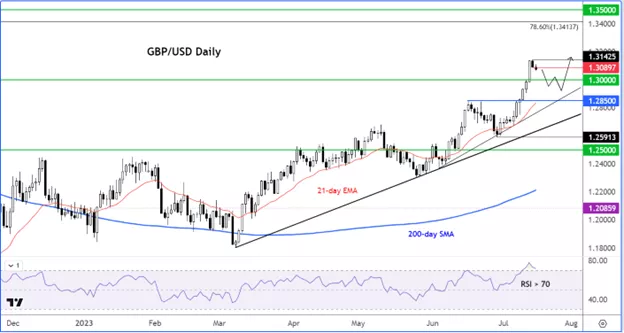
Source: TradingView.com
More By This Author:
Crude Oil Likely Heading Further Higher
Pound Analysis: GBP/USD, GBP/JPY Outlook Positive As Data Supports More BoE Hikes
Gold Rises With US CPI In Sharp Focus


Comments
Log in or sign up to join the conversation.