
Summer is here, and it’s time for a vacation. But this year, flight schedules are anything but reliable, and that new car for the road trip is probably not available at the local Toyota, Honda, Tesla, General Motors, Ford, etc dealership. Due to chip shortages and other issues, most car dealerships have little to no inventory to sell.
High inflation and rising interest rates combined with high gasoline prices are causing people to rethink or pay more attention to their monthly budget expenditures.
Furthermore, if you do decide to buy a used car, be prepared to pay top dollar. In some cases, a 3-year-old model may cost you as much as a new one. Historically autos almost always depreciate, but we are in an unusual market phenomenon where many used cars have appreciated significantly.
What about the auto company stocks themselves? Cash is looking great versus owning one of these auto brands.
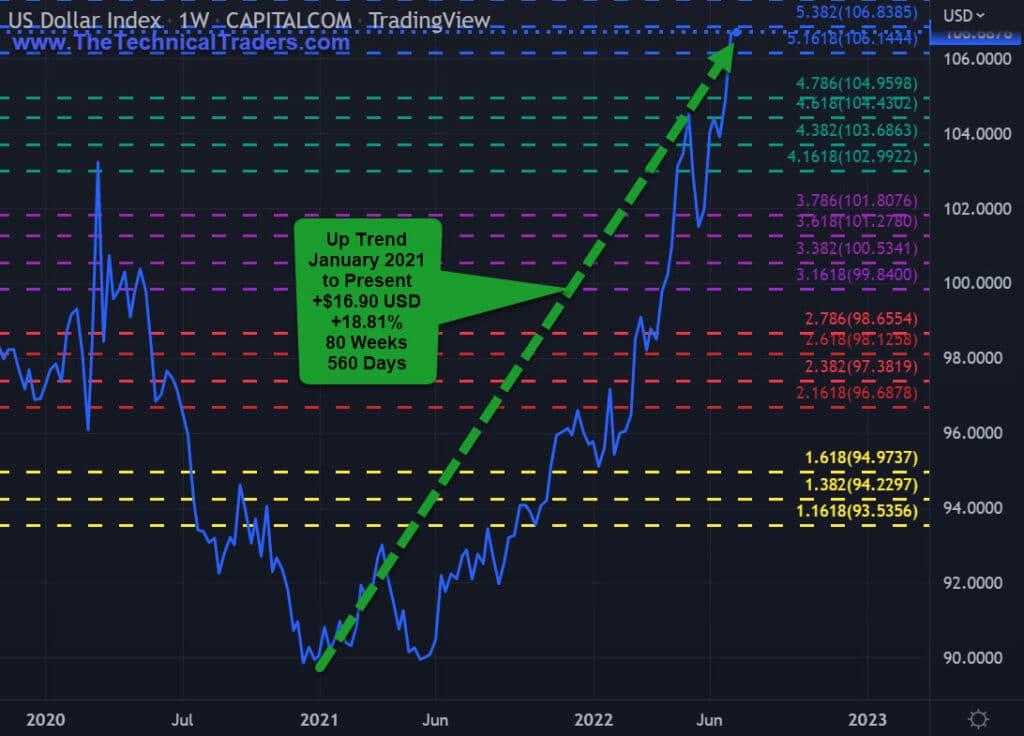
Before we motor into the auto company stocks, let’s take a quick look at cash (the U.S. Dollar).
U.S. Dollar +18.81%
- U.S. Dollar making a new 14-year high
- 2020-2022 U.S. Presidential Cycle: USD appreciated +18.74% to date
- 2016-2020 U.S. Presidential Cycle: USD depreciated – 12.80%
- 2012-2016 U.S. Presidential Cycle: USD appreciated +37.20%
US Dollar Index • DXY • Capitalcom • Weekly
(Click on image to enlarge)
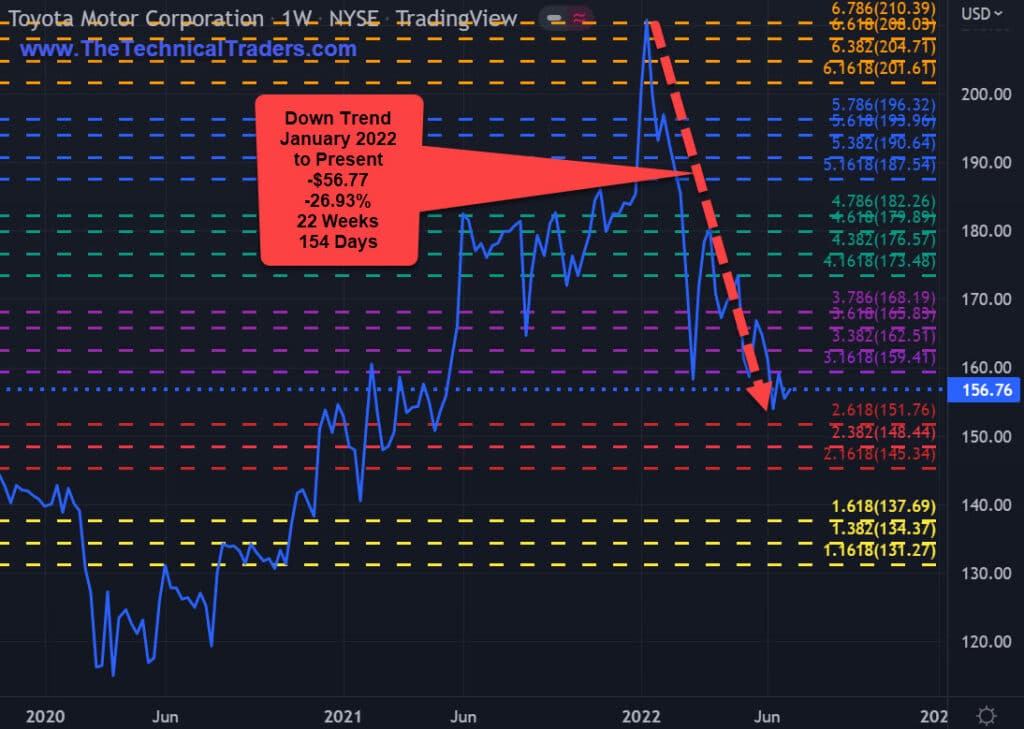
Toyota -26.93%
- January 2022 to present
- -$56.77 or -26.93%
- 22 weeks or 154 days down
- The bear market has more room to drop; if you own it consider selling on rallies and going to cash
Toyota Motor Corporation • TM • NYSE • Weekly
(Click on image to enlarge)
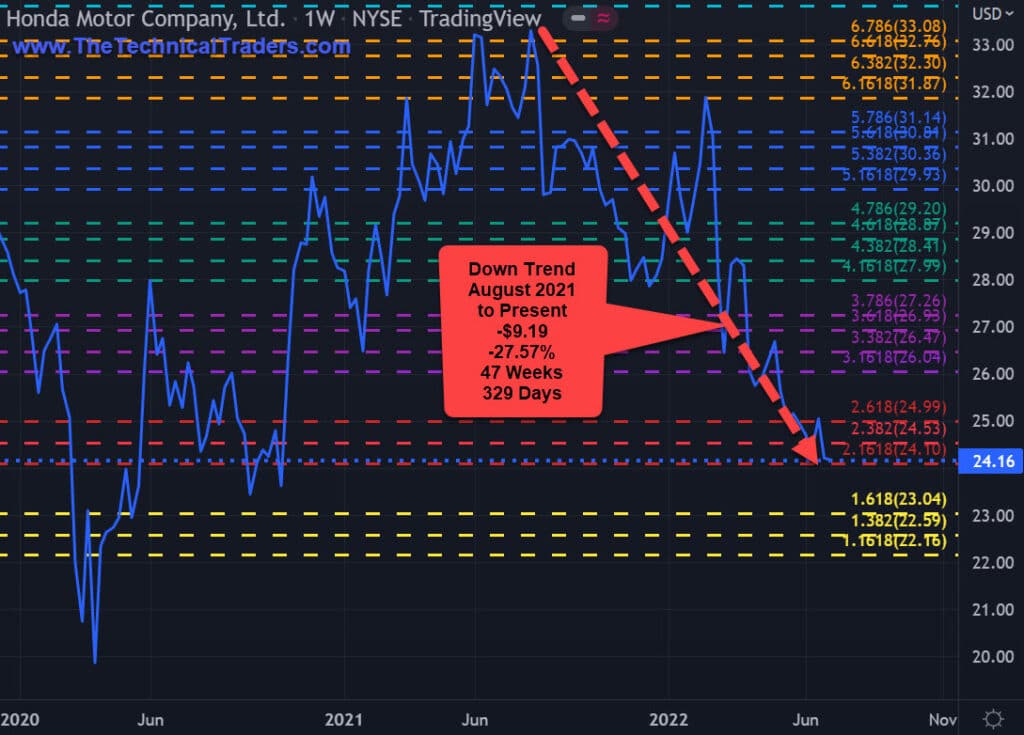
Honda -27.57%
- August 2021 to present
- -$9.19 or -27.57%
- 47 weeks or 329 days down
- The bear market has more room to drop; if you own it consider selling on rallies and going to cash
Honda Motor Company, Ltd. • HMC • NYSE • Weekly
(Click on image to enlarge)
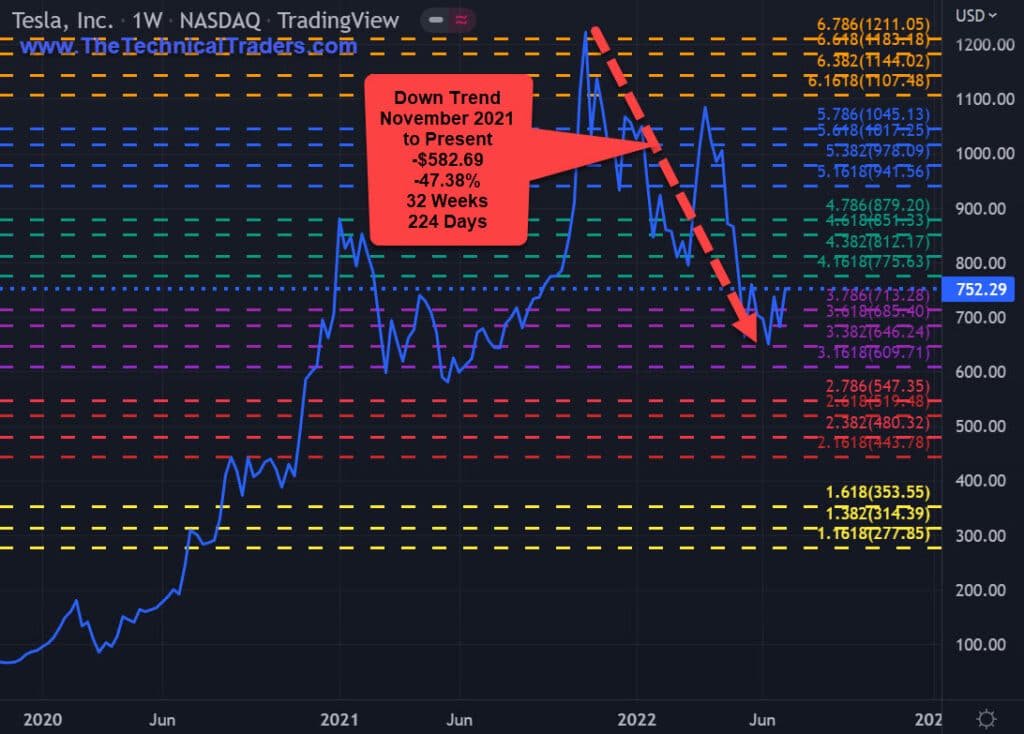
Tesla -47.38%
- November 2021 to present
- -$582.69 or -47.38%
- 32 weeks or 224 days down
- The bear market has more room to drop; if you own it consider selling on rallies and going to cash
Tesla, Inc. • TSLA • Nasdaq • Weekly
(Click on image to enlarge)
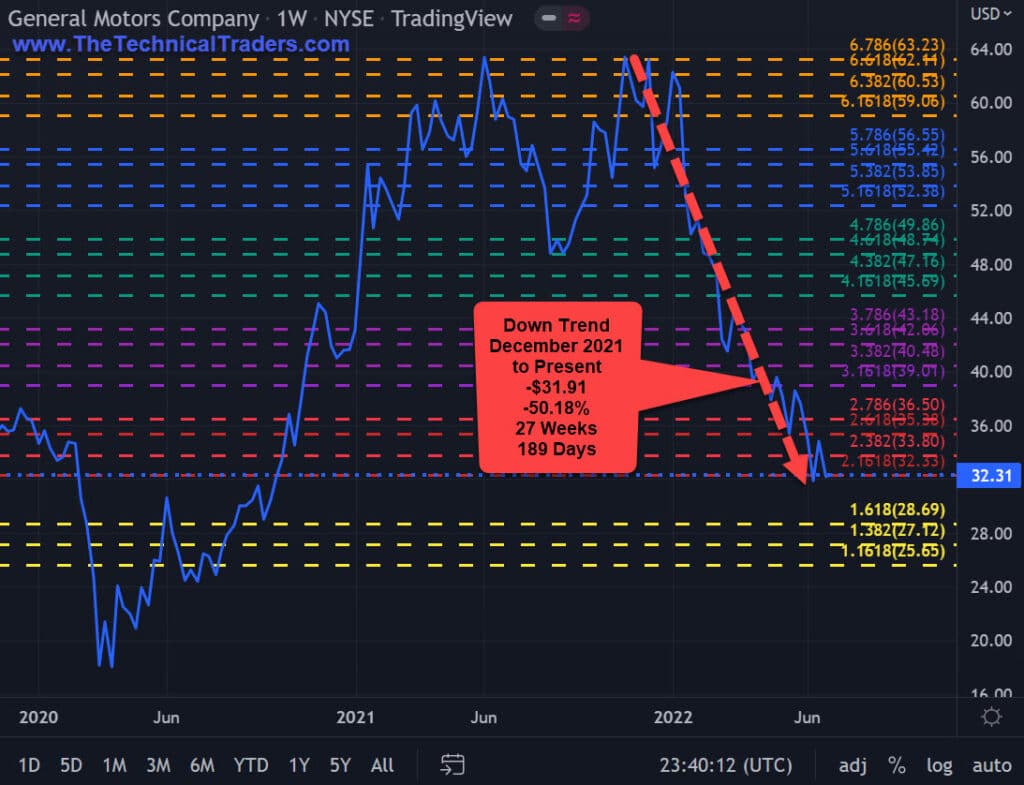
General Motors -50.18%
- December 2021 to present
- -$31.91 or -50.18%
- 27 weeks or 189 days down
- The bear market has more room to drop; if you own it consider selling on rallies and going to cash
General Motors Company • GM • NYSE • Weekly
(Click on image to enlarge)
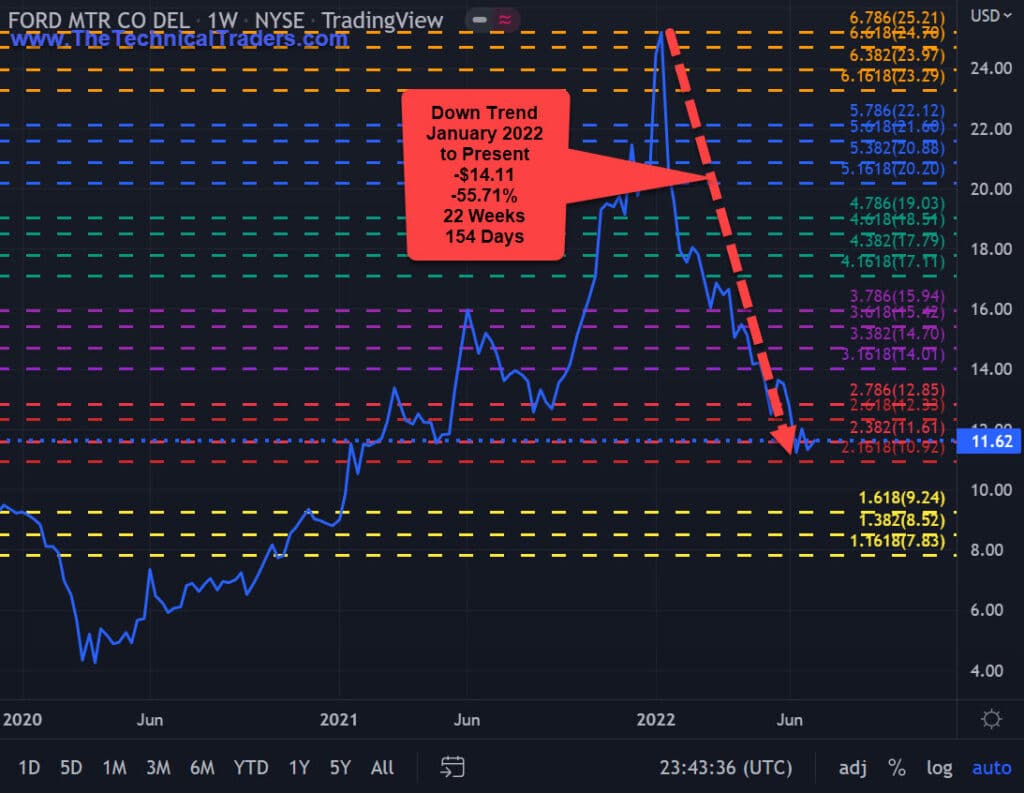
Ford -55.71%
- January 2022 to present
- -$14.11 or -55.71%
- 22 weeks or 154 days down
- The bear market has more room to drop; if you own it consider selling on rallies and going to cash
Ford Motor Company • F • NYSE • Weekly
(Click on image to enlarge)
More By This Author:
BIL ETF – Trade Setup Of The WeekDoes Selling Put Options During A Market Downturn Provide A Safety Net?
Crude Oil Collapsed Below $100ppb – Has The Us Fed Broken Inflation?


Comments
Log in or sign up to join the conversation.