
The stock market is never obvious. It is designed to fool most of the people, most of the time. ~ Jesse Livermore

In this week’s Dirty Dozen [CHART PACK] we look at multiple breadth thrust signals, historically bullish technical developments, negative sentiment, make the bull case for Japan, and end with a look at crypto.
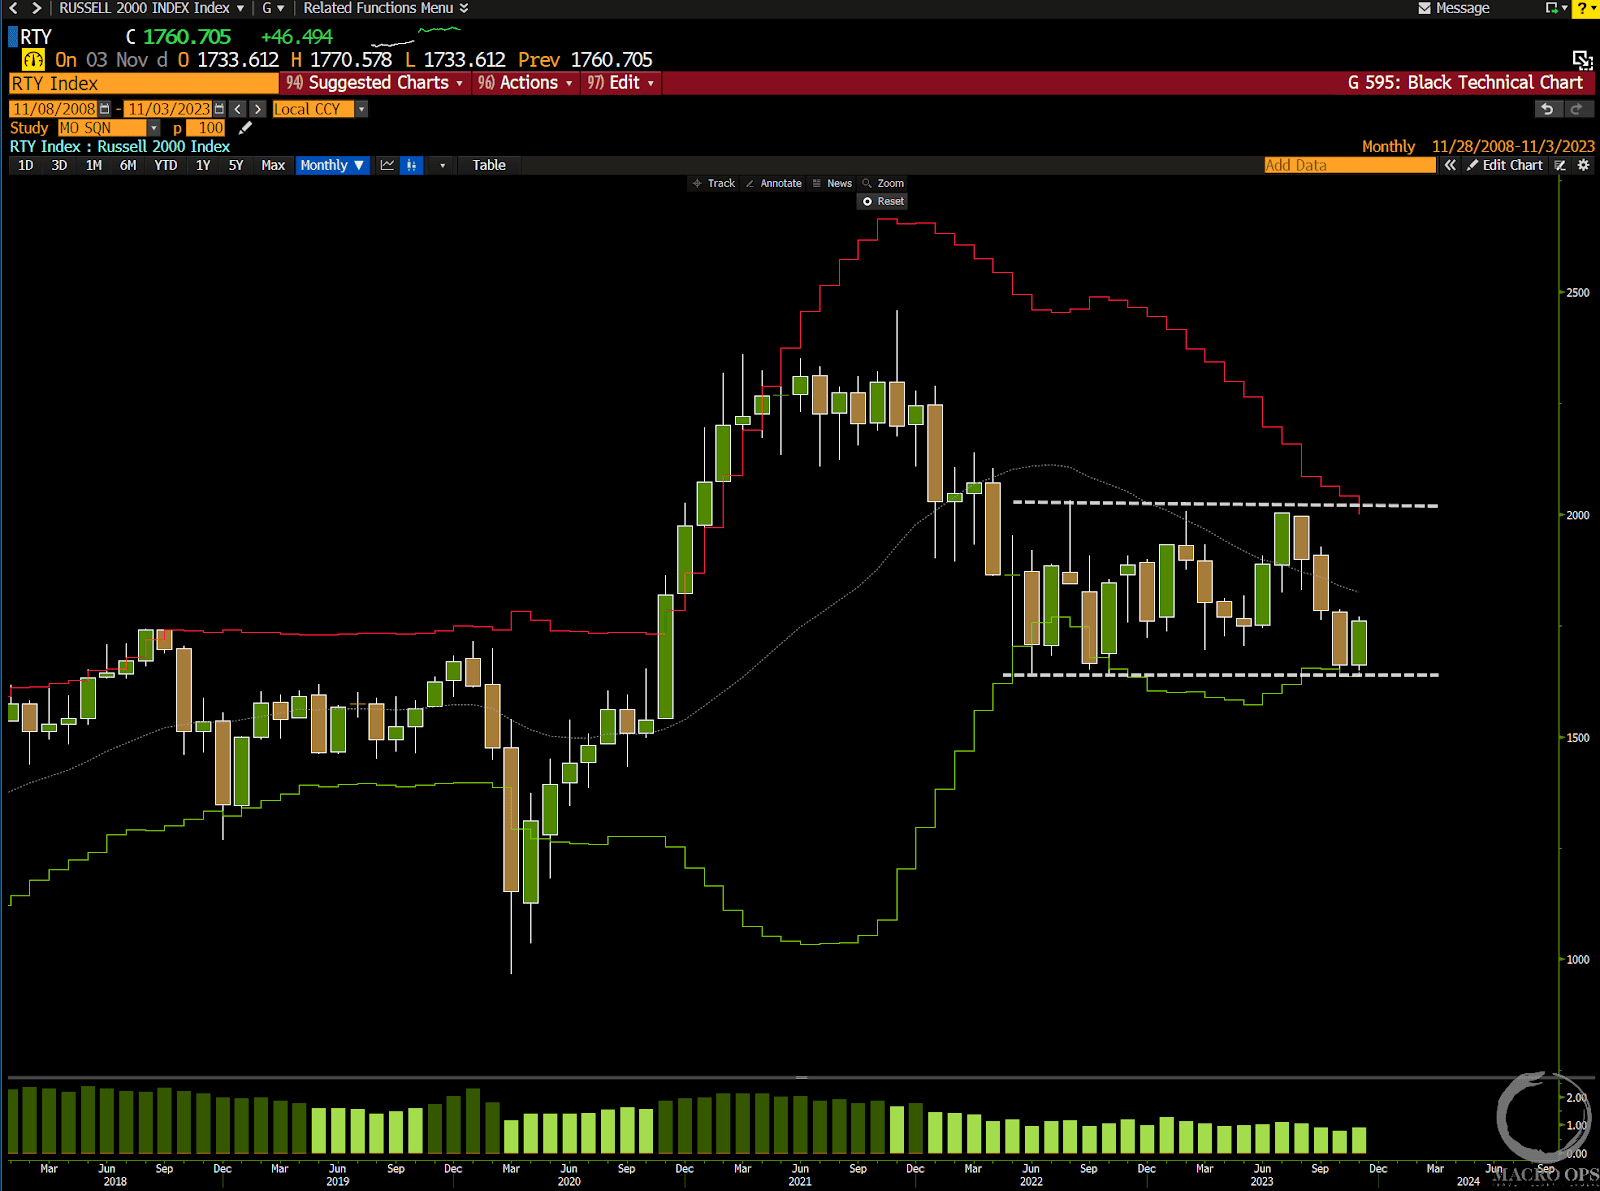
1. Small-caps saw a strong reversal at a key level last week as they managed to avoid a major technical breakdown and move back within their broader sideways range.
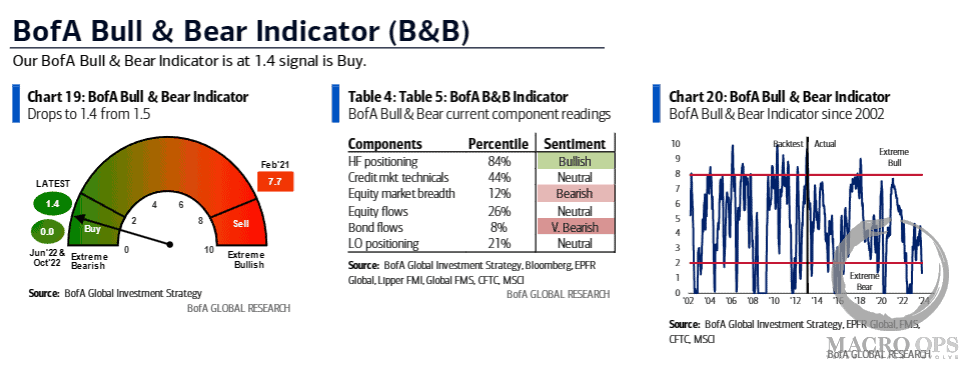
2. The backdrop for this reversal was the dour sentiment over the past few weeks as illustrated by the recent BofA Bull & Bear buy signal.
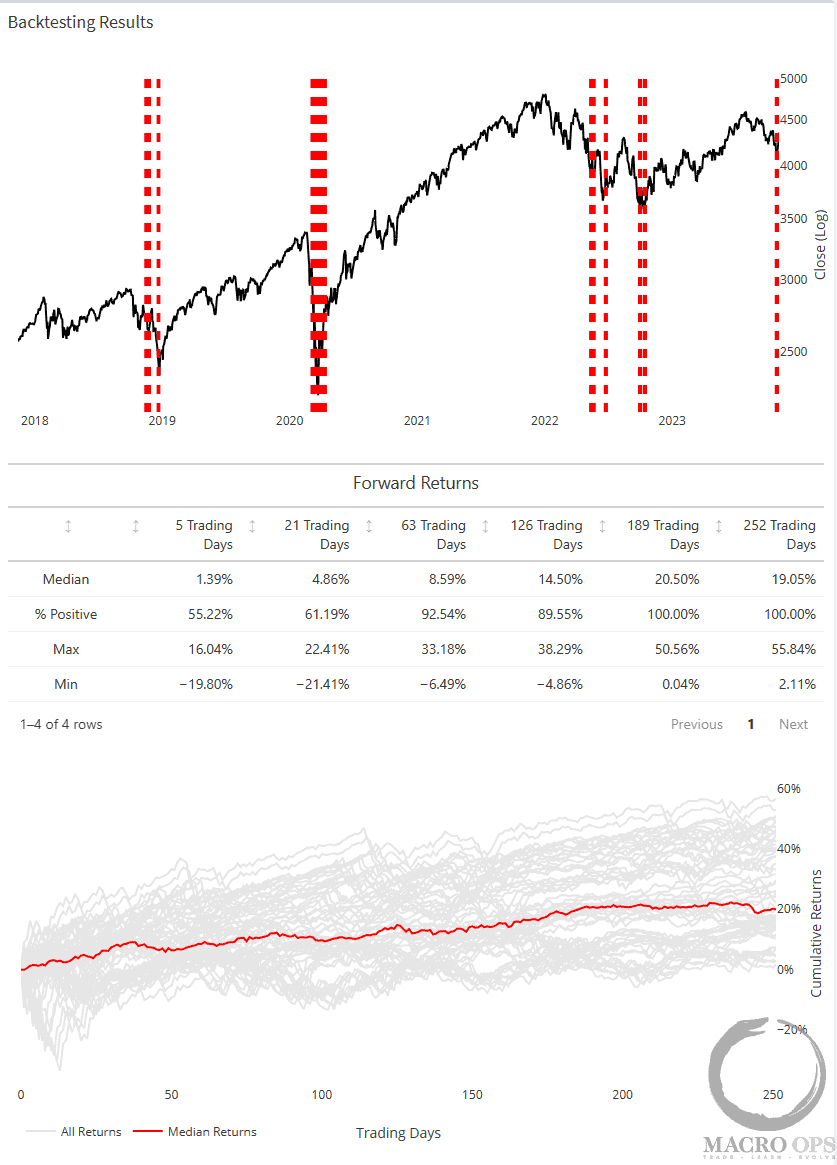
3. I recently pointed out the bullish implications from the low reading we were seeing in our NAAIM oscillator. Our new Backtesting tool (Collective members can find this in the HUD) shows the historical forward returns for past readings, which skews heavily positive.
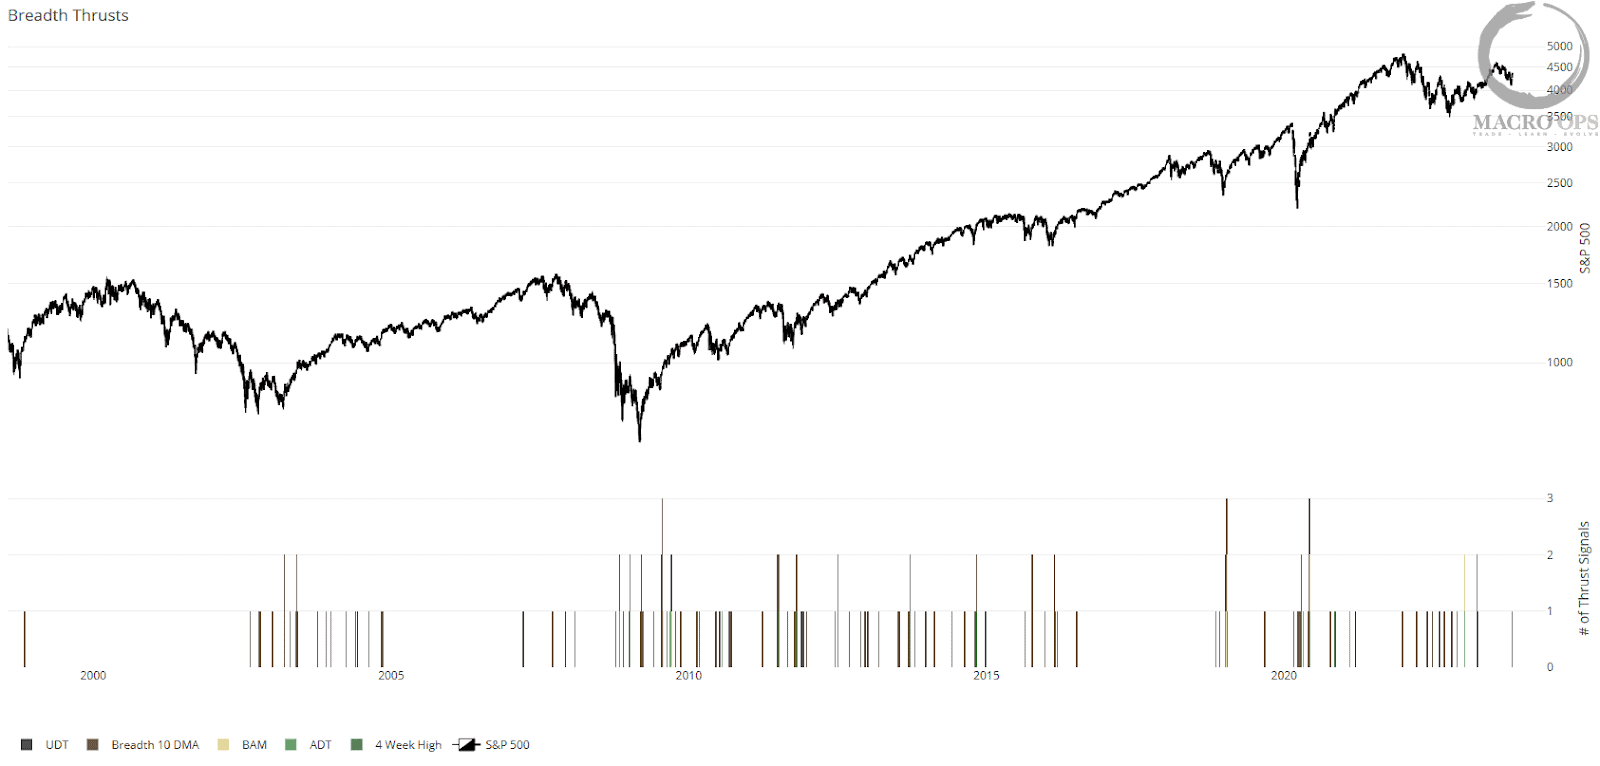
4. Our breadth thrust indicator saw a signal fire last week with the percent of stocks above their 10dma showing a positive thrust. The signal value of breadth thrusts increases significantly when we see a cluster of them over a short period of time (as shows by the taller lines on the chart below).
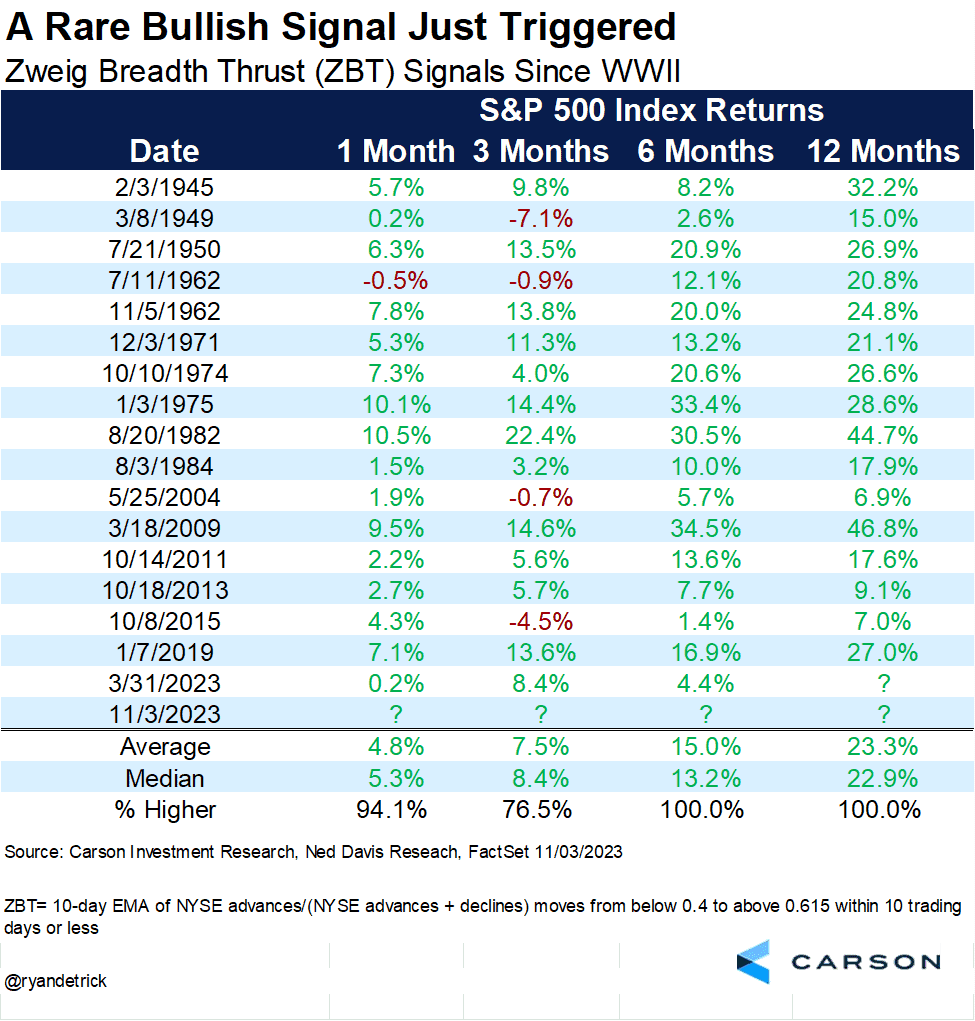
5. In addition to a %10dma thrust we also saw a more rare Zweig Breadth Thrust last week, shown here in this chart from @RyanDetrick.
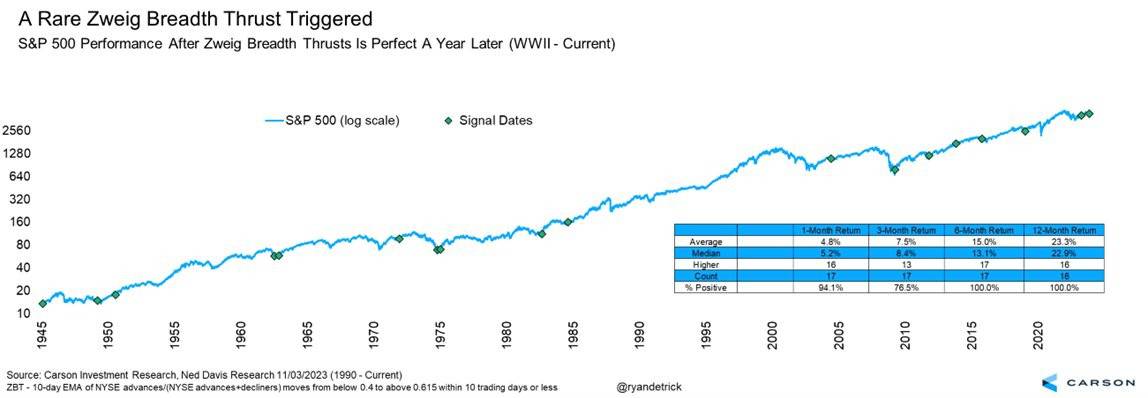
6. Here’s the forward returns for past instances, also from Ryan. Not too shabby…
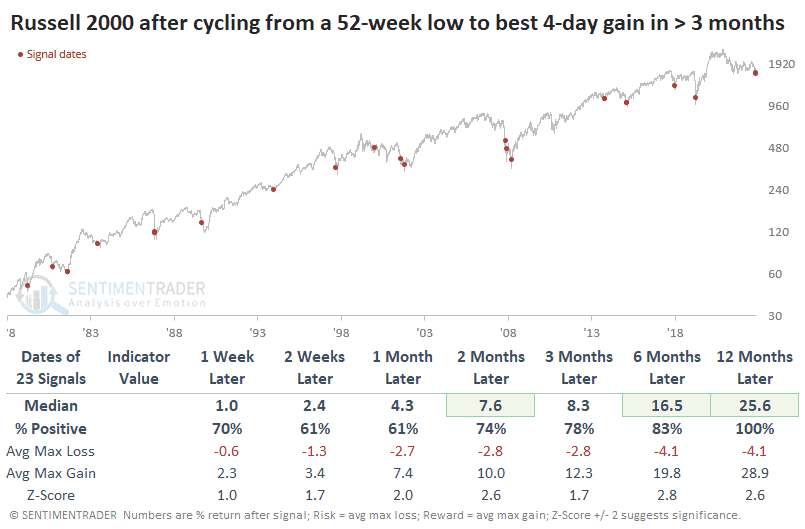
7. @jasongoepfert of SentimenTrader shared the following last week:
“This is the 24th time the Russell 2000 closed at a 52-week low, then surged to its best 4-day rally in at least 3 months.
A year later, the small-cap index was higher 100% of the time with a median return of +25.6%.”
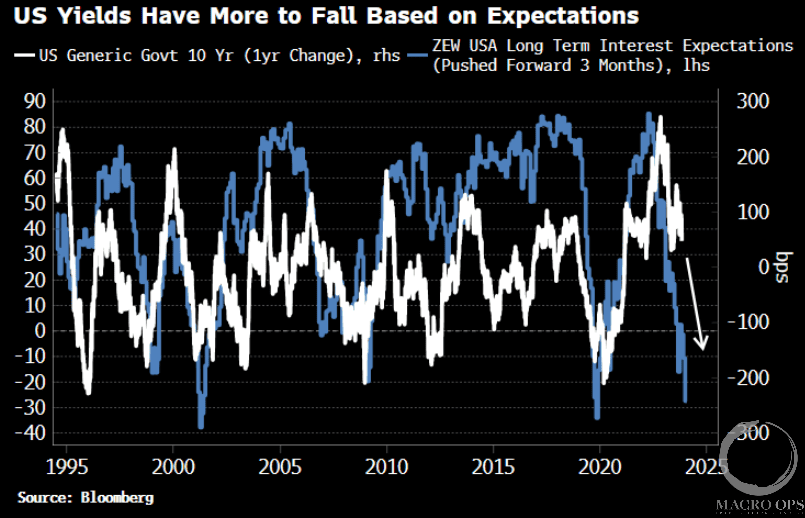
8. The strong bid in bonds last week provided a much needed tailwind to stocks, and if the ZEW US long-term interest expectations continues to be a quide then US yields should continue to come in over the intermediate term (chart via BBG’s Simon White).
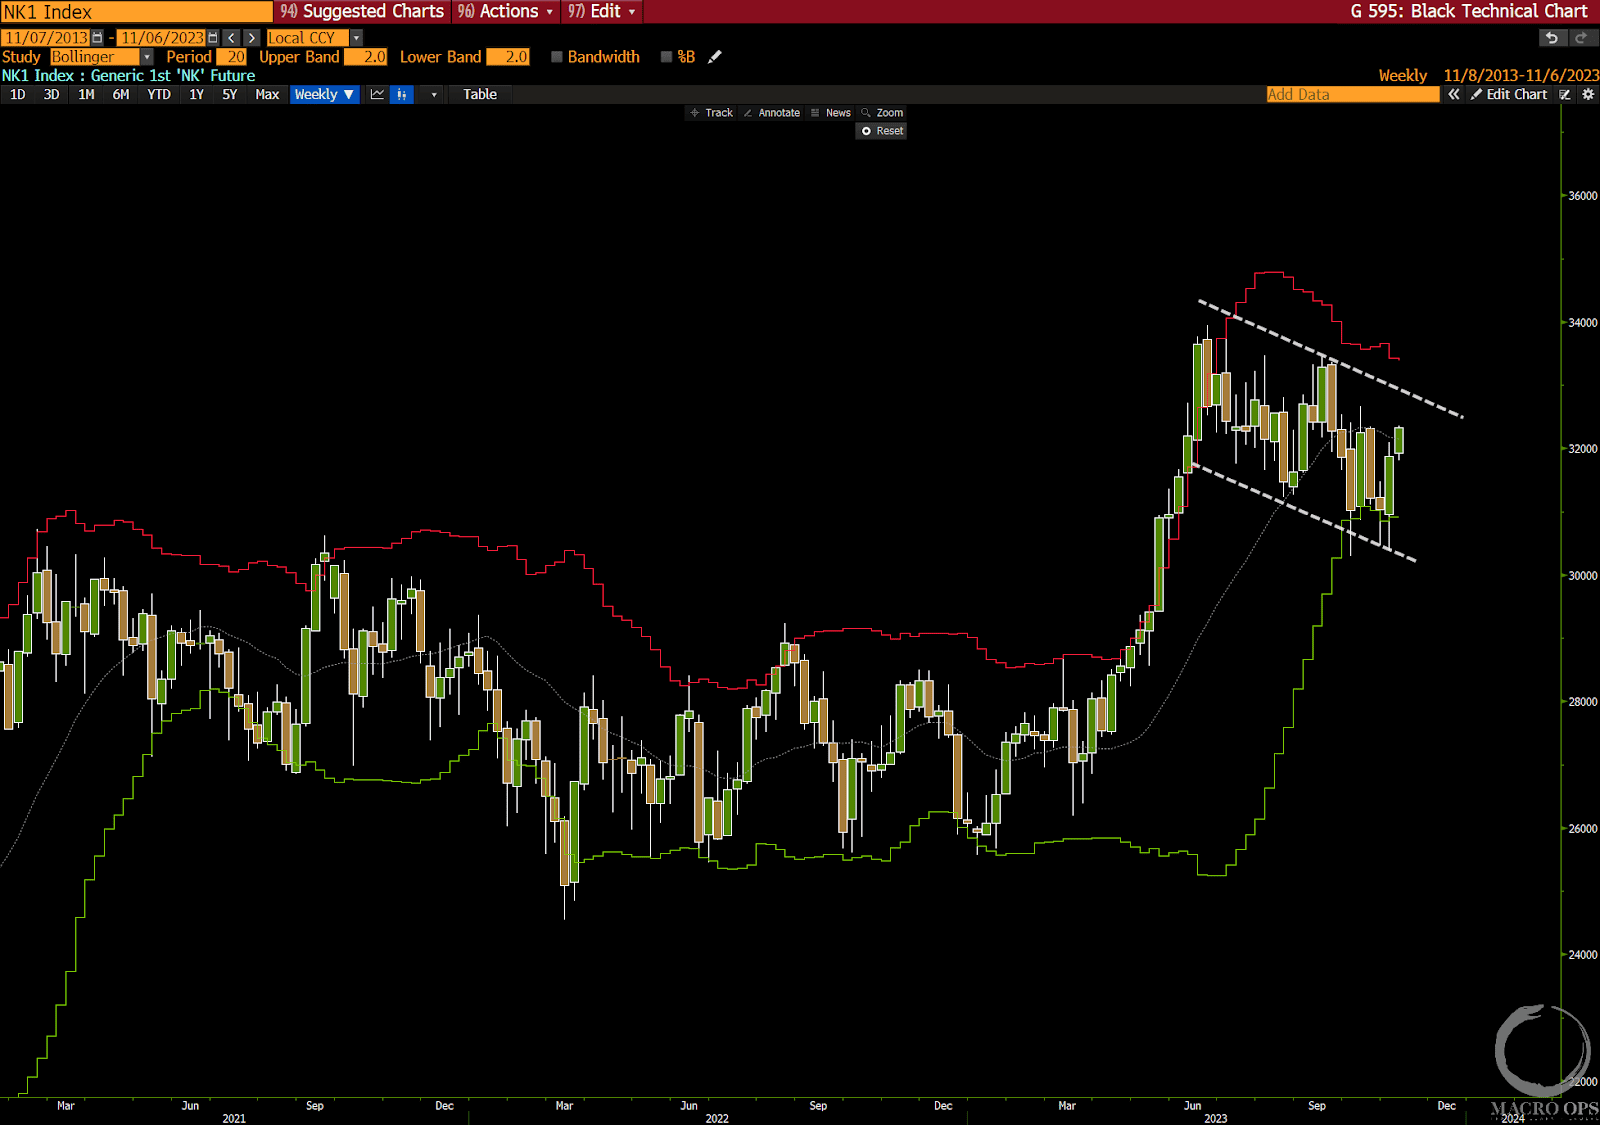
9. Japan’s Nikkei 225 continues to have one of the best looking long-term charts. It’s been in a tight 6-month pullback following a large bullish thrust (chart below is a weekly).
It put in a double bottom last week and the tape looks increasingly ripe for a bullish breakout.
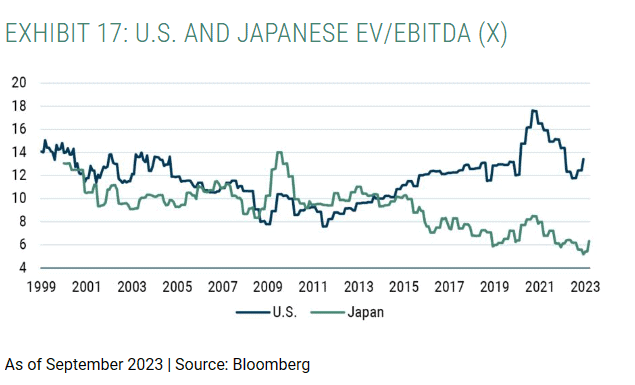
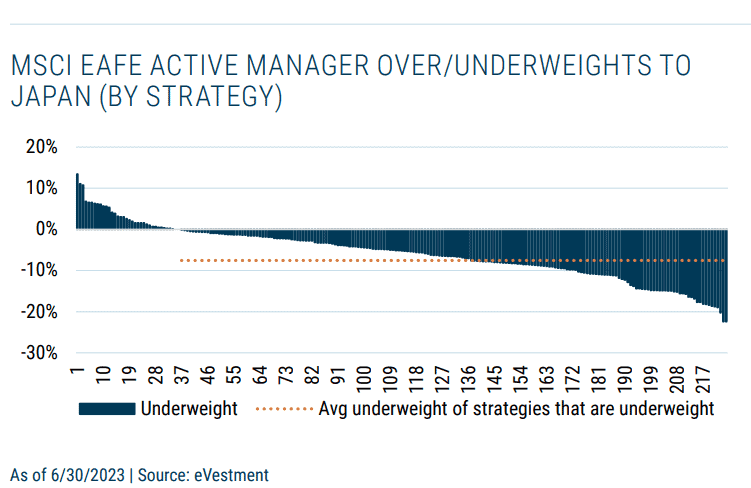
10. GMO published some research over the past month outlining the bull case for Japan (link here). They argue that Japan remains extremely cheap on both a relative and absolute basis, and is still grossly underowned by managers.
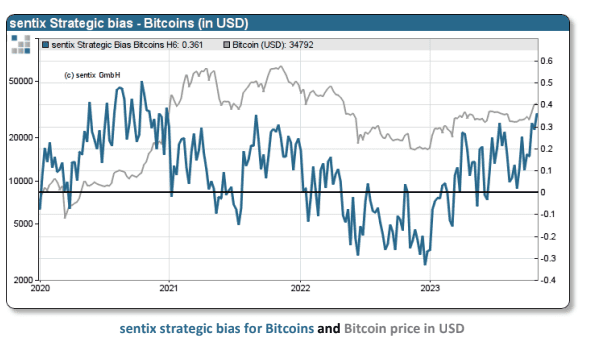
11. BTCUSD has shown strong relative strength over the past few weeks. And the conditional backdrop is also quite positive for crypto right now. Large specs are short while the strategic bias for BTCUSD is trending up to new highs for the year.
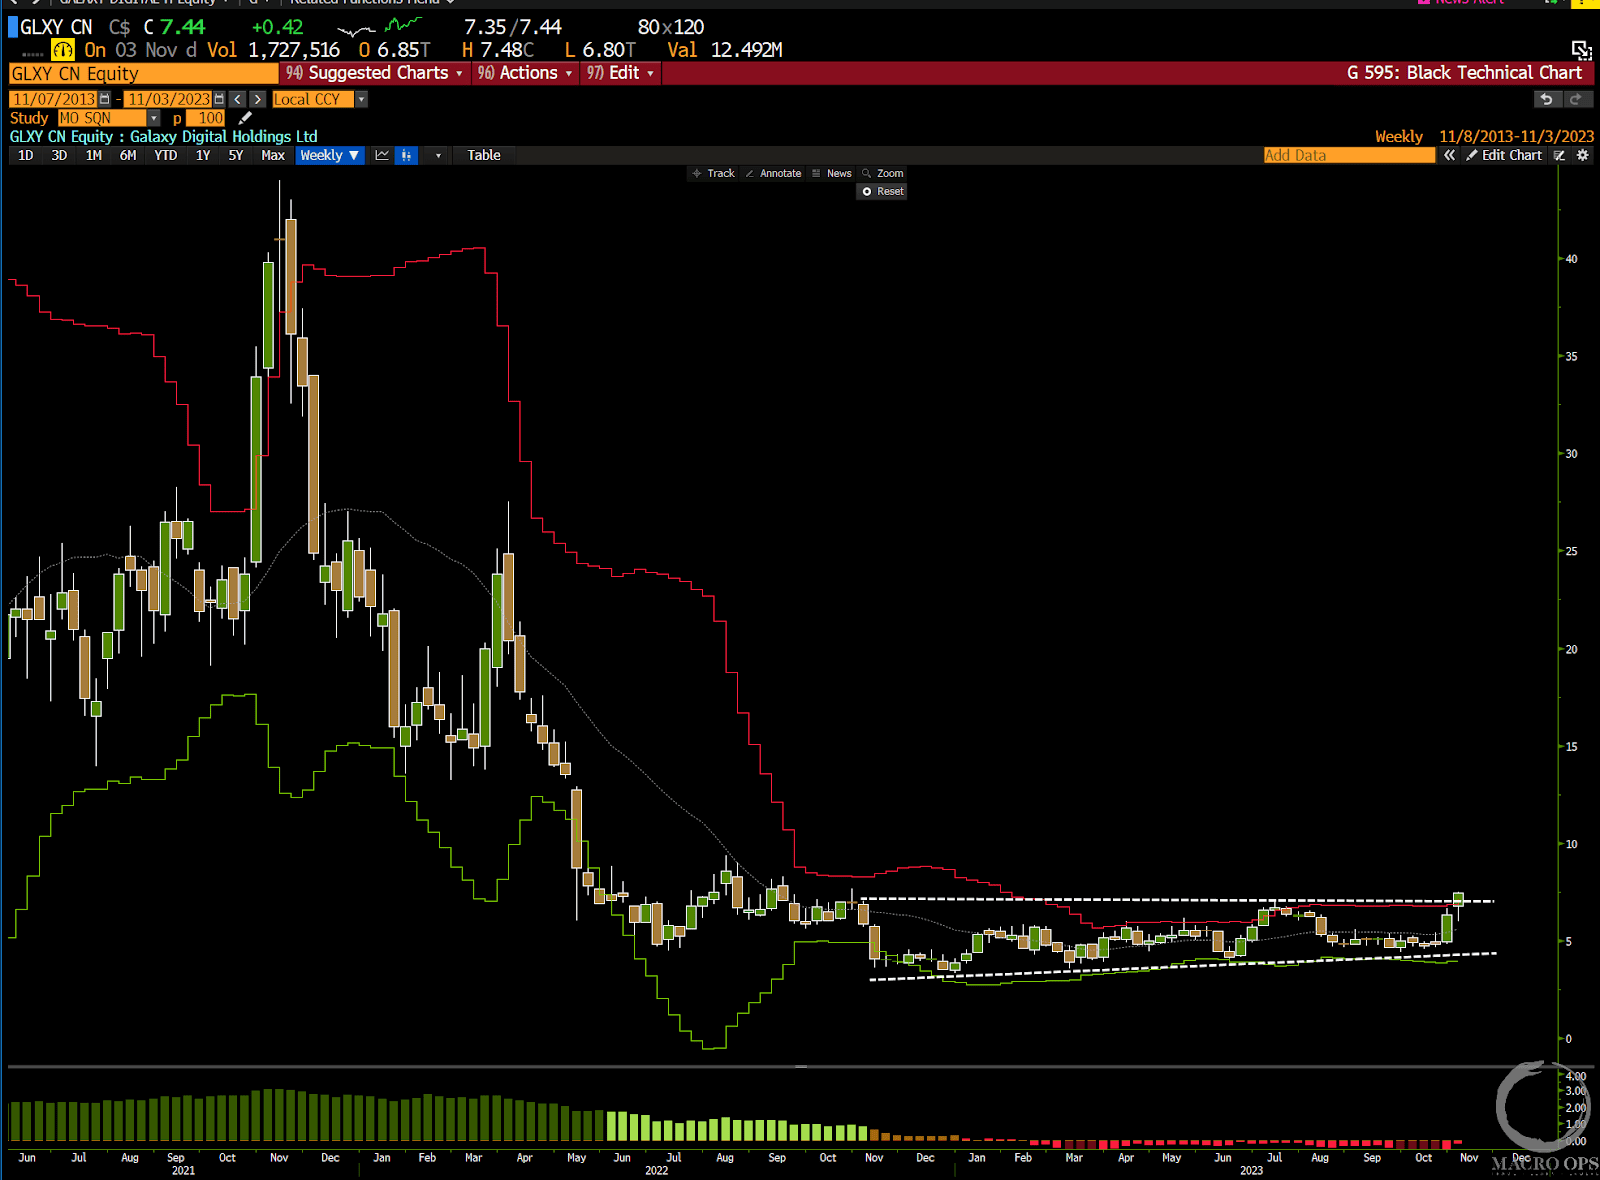
12. One way to play a resurgence in the crypto trade outside of buying the underlying is to go long Galaxy Digital Holdings. Its chart is making a run at breaking out of a 14-month basing pattern.
Thanks for reading.
More By This Author:
A Golden Bull…A Contrarian Buy Signal Is Triggered…
Big Opp In Barbarous Relic…

Comments
Log in or sign up to join the conversation.