
British Pound Techs: GBP/USD Two-Year-Highs, GBP/JPY Wedge Break
Sterling started the year on a boisterous note, setting a fresh two year high as the calendar turned into 2021. But GBP/USD soon found resistance at a Fibonacci level and prices have begun to pull back, begging the question as to whether Cable bulls will be able to continue driving even with increasing risk around the U.K. economy after another lockdown was ordered. This helped to elicit a bit of a pullback in GBP/USD, but so far buyers have helped to hold the bid above the key psychological level of 1.3500.
On the weekly chart below, that recent bullish breakout is in full view, along with the Fibonacci resistance that’s come into play to help hold the highs. The 76.4% retracement of the 2018-2020 major move plots at 1.3678.
GBP/USD WEEKLY PRICE CHART
(Click on image to enlarge)
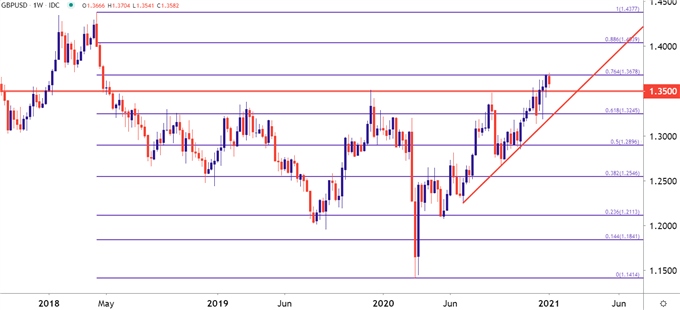
Chart prepared by James Stanley; GBPUSD on Tradingview
Taking a shorter-term look at the matter, and we have some messy prior price action; owed in part to both Brexit drivers going into the end of 2020 along with USD-themes that remain fairly unsettled, in their own right. Nonetheless, there is still some structure to work with, key of which would be the 1.3500 zone of possible higher-low support. At this point, a bit of support has held from around a prior swing-high from early-December around 1.3539; but buyers haven’t yet been able to do much, keeping the door open for a steeper fall in the pair.
Given dynamics in other major pairings such as EUR/USD or AUD/USD, GBP/USD may be one of the more attractive candidates to work within scenarios of extended USD-strength.
For those that are looking to establish bearish exposure in the pair, the possibility of a lower-high at or around the 1.3678 Fibonacci level could make for a rather exciting reversal backdrop. But, that lower-high may also print a bit earlier than 1.3678, and a set of prior price action swings from 1.3625-1.3641 could present such an area of interest.
GBP/USD FOUR-HOUR PRICE CHART
(Click on image to enlarge)
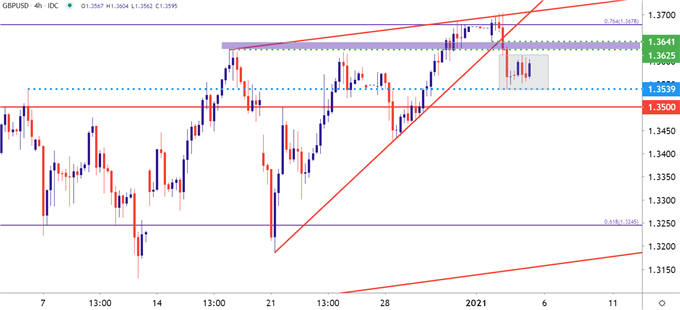
Chart prepared by James Stanley; GBPUSD on Tradingview
GBP/JPY STRUGGLES BELOW 140.00 FOLLOWING WEDGE BREAK
GBP/JPY has been even a bit more subdued from the GBP/USD setup looked at above: Case in point, as GBP/USD rushed up to that fresh two-year-high around the 2021 open, GBP/JPY remains well below the September swing-high.
What is interesting in GBP/JPY, however, is the fact that the pair is trying to maintain a bullish breakout from a symmetrical wedge that took most of last year to build. This wedge contained most 2020 price action in the pair until the first daily close outside of the formation showed on December 30th.
GBP/JPY DAILY PRICE CHART
(Click on image to enlarge)
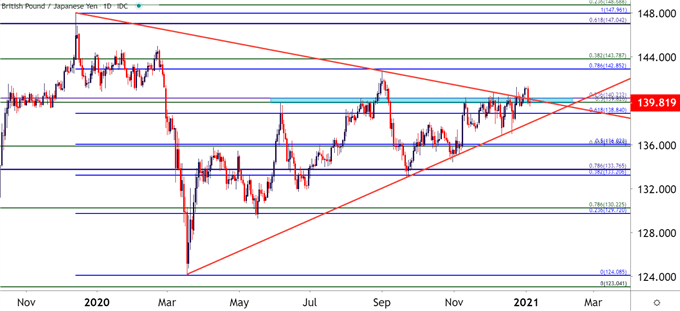
Chart prepared by James Stanley; GBPJPY on Tradingview
Disclosure: See the full disclosure for DailyFX here.


