

Photo by Colin Watts on Unsplash
The British pound sterling is showing signs of recovery, bouncing back from a five-month low, with GBP/USD stabilizing around the 1.2470 mark on Thursday. This rebound is attributed to the release of UK inflation data, suggesting a possible monetary policy easing by the Bank of England (BoE).
The UK's consumer price index (CPI) slowed to 3.2% year-on-year in March, down from 3.4% in February, marking the lowest inflation rate in two and a half years. This slowdown has raised investor optimism regarding potential policy easing by the BoE, particularly since core inflation has also dropped to its lowest since mid-2021. However, persistent inflation in the services sector may lead to cautious deliberation among certain members of the monetary committee.
Meanwhile, representatives from the US Federal Reserve have reiterated that US interest rates are likely to remain high for an extended period. In contrast, the BoE is perceived as relatively stable, potentially initiating monetary policy easing by summer.
The first quarter saw significant pressures from the tight employment market and shocks from rising energy prices, which initially suggested that the BoE might follow the European Central Bank (ECB) and the Fed in lowering interest rates. However, market conditions have shifted considerably. Exchange analysts now anticipate that the ECB might cut interest rates by June, the BoE by September, and the Fed only in Q4.
Technical analysis of GBP/USD
(Click on image to enlarge)
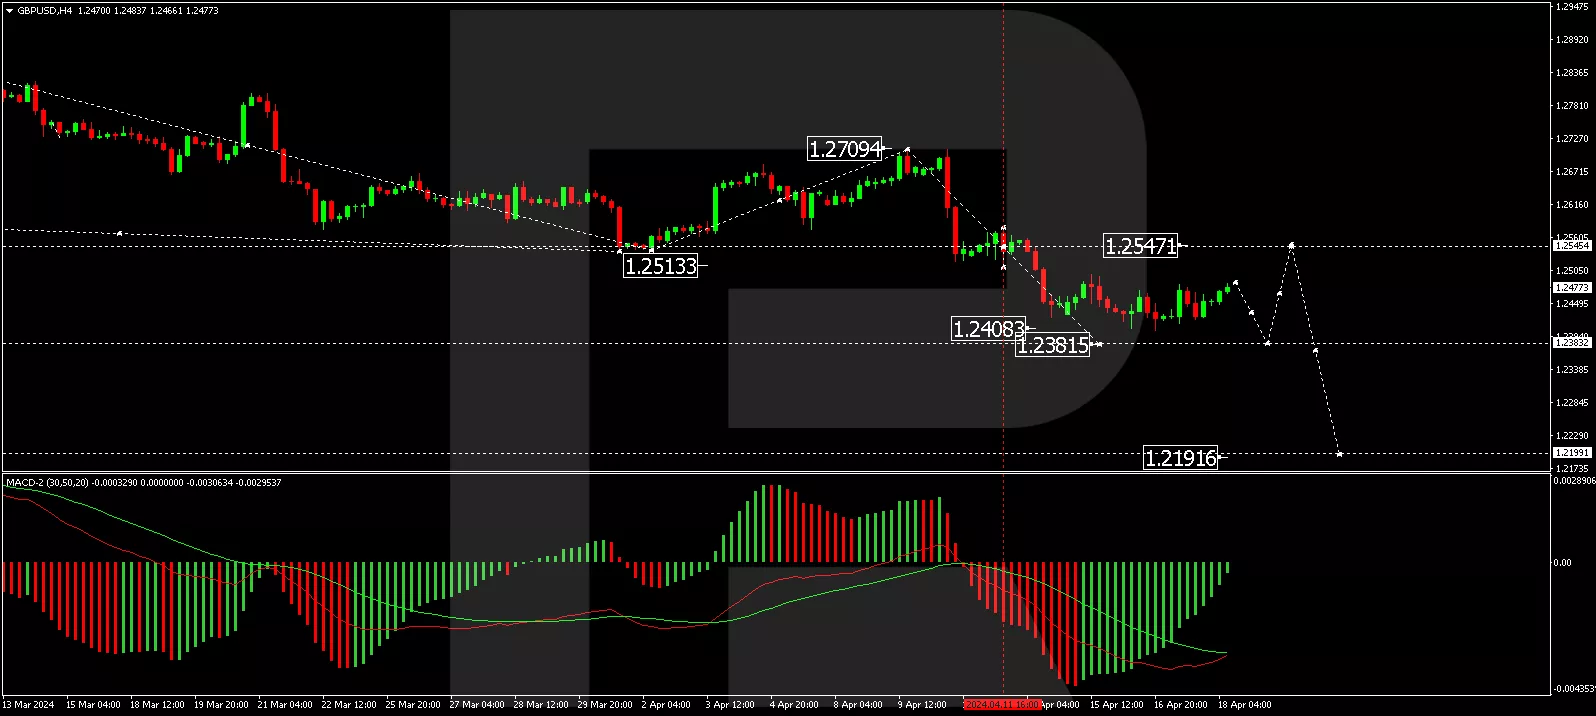
The H4 chart for GBP/USD indicates that after forming a consolidation range of around 1.2547, the pair has reached the target of 1.2450 with a downward exit. A new consolidation range is currently forming above this level. A break below this range may drive prices lower to 1.2380, with a subsequent correction to retest 1.2547 (testing from below) before a possible continuation to 1.2200. This bearish scenario is supported by the MACD oscillator, whose signal line is below zero and is trending downwards.
(Click on image to enlarge)
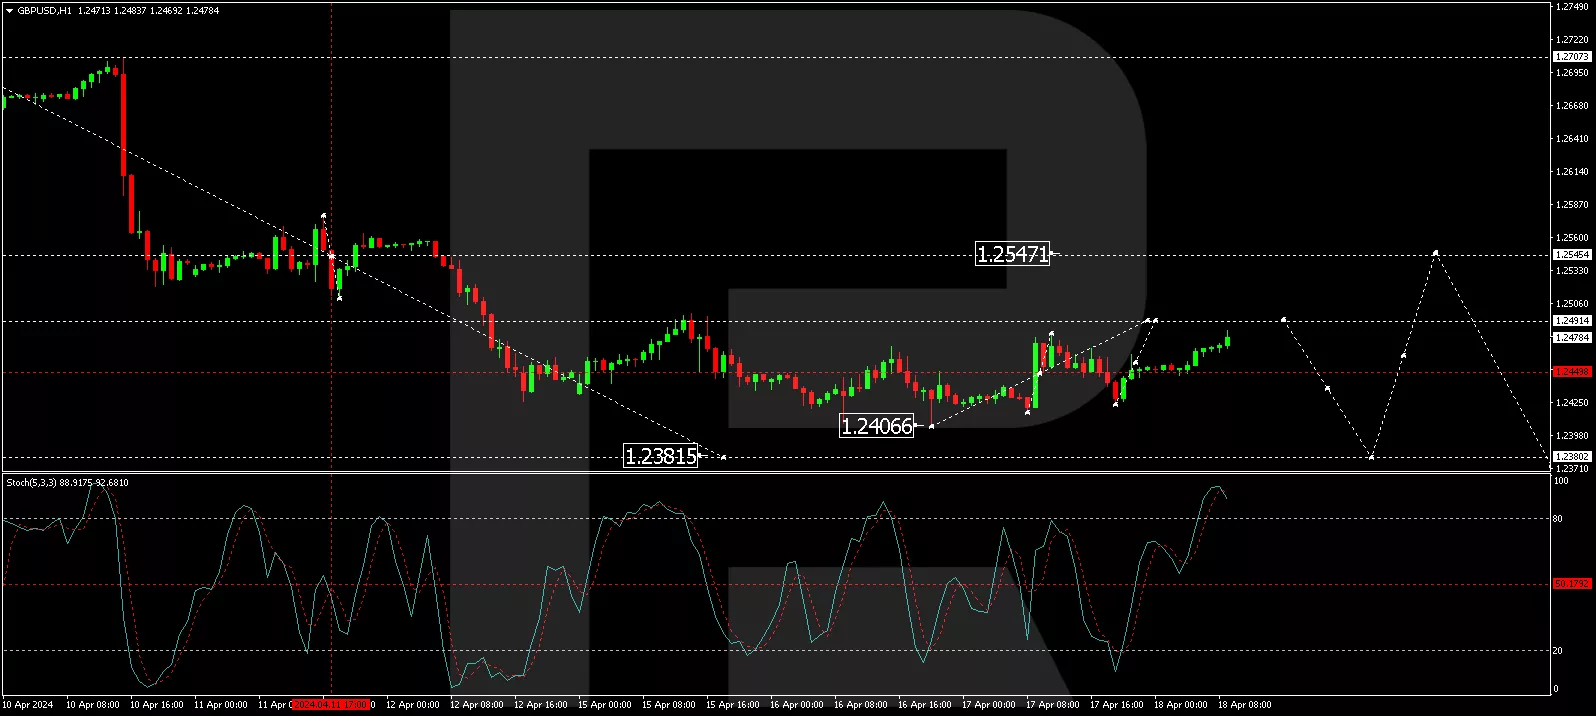
On the H1 chart, the GBP/USD has completed a decline to 1.2406 and is currently undergoing a correction to 1.2491. Following this correction, a new decline to 1.2381 is anticipated. The Stochastic oscillator, currently above 80, is poised for a sharp decline to the 20 mark, reinforcing the likelihood of further downward movement in the short term.
More By This Author:
Brent Crude Prices Dip Amid Concerns Over Global Demand
NZD Hits Five-Month Low Against Strong US Dollar
US Dollar Exhibits Remarkable Strength Amid Global Tensions


Comments
Log in or sign up to join the conversation.