
Cable (GBP/USD) is up over 14% since it hit its nadir on September 26 and now is looking at levels last seen nearly three months ago. The heavy Liz Truss/Kwasi Kwarteng sell-off in Sterling has been mostly reversed, while the recent weakness of the US dollar is giving the move a secondary push. The US dollar has fallen sharply over the last two weeks as traders pare back their bets of another super-sized US rate hike for a more moderate approach.
This trimming of expectations was noted over the weekend by Federal Reserve Governor Christopher Waller who said that last Friday’s US CPI report was ‘just one data point’ and that 7.7% was still an ‘enormous’ number. He added that while the Fed may consider slowing the pace of future rate hikes, this does not mean that the central bank was ‘softening’ its commitment to crimp price pressures.
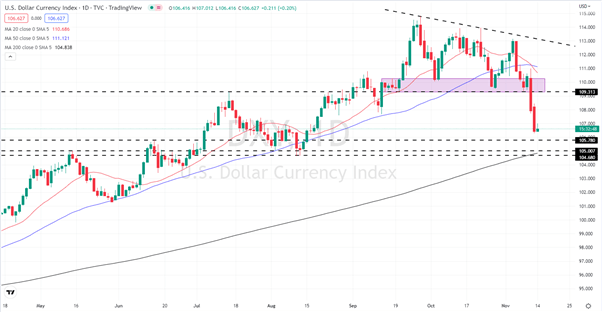
While market expectations are moving lower, US Treasury yields remain lofty, underpinning the greenback and limiting further losses. US 1-year paper still offers a chunky 4.62% yield, while the 2-year UST offers 4.39%.
US Dollar Basket (DXY)
(Click on image to enlarge)
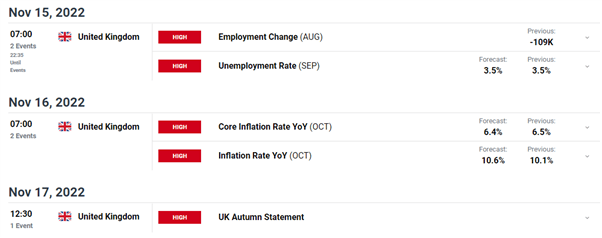
This week Sterling traders will have some domestic data and events to look at with the latest unemployment and inflation releases on tap. The UK jobs market remains strong but may start to see a shift in the coming months as the economy slows further, while headline inflation is expected to push higher again in this month’s report before heading sharply lower next year. There is also the delayed Autumn Statement on Thursday where Chancellor Jeremy Hunt is expected to cut spending and increase a range of taxes to fill a £50bn black hole created by the last, short-lived, Conservative government.
For all market-moving data releases and economic events see the DailyFX Calendar.
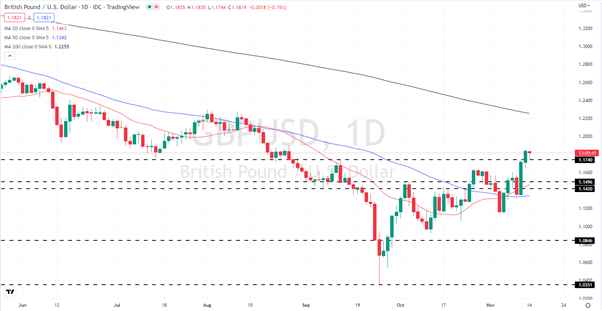
The move higher in the cable is now slowing down and will likely respond to this week’s calendar events. The 1.1740 level may act as short-term support ahead of 1.1650, while last Friday’s 1.1855 print will act as first-line resistance.
GBP/USD Daily Price Chart – November 14. 2022
(Click on image to enlarge)
Charts via TradingView
Retail Traders Slash Their GBP/USD Exposure
Retail trader data show 42.46% of traders are net-long with the ratio of traders short to long at 1.36 to 1. The number of traders net-long is 10.98% higher than yesterday and 32.37% lower than last week, while the number of traders net-short is 3.44% higher than yesterday and 44.60% higher than last week.
We typically take a contrarian view to crowd sentiment, and the fact traders are net-short suggests GBP/USD prices may continue to rise. Positioning is less net-short than yesterday but more net-short from last week. The combination of current sentiment and recent changes gives us a further mixed GBP/USD trading bias.
What is your view on the British Pound – bullish or bearish?
More By This Author:
USD/JPY Weakness Leaves 140.00 As The Next Downside ObjectiveBritish Pound Latest: GBP/USD Still Vulnerable To Swings In Sentiment
Gold (XAU/USD) Rally Stalls For Now As The US Dollar Looks To Recover


Comments
Log in or sign up to join the conversation.