
Bitcoin, Ripple And Ethereum Levels To Watch After The SEC Blow
- The US SEC decided to postpone a decision on approving an ETF to 2019
- The move sparked a fresh sell-off, with Bitcoin, Ethereum, reaching new lows.
- Here are the levels to watch according to our proprietary technical tool.
The US Securities and Exchange Commission (SEC) decided to delay, once again, its decision on a request for an Exchange Traded Fund (ETF) for Bitcoin. The request, made by SolidX Partners and asset manager Van Eck had a deadline of December 29th but was pushed back to around February.
A Bitcoin ETF would enable mainstream investors to jump into the world of cryptocurrencies. Delays have been key adverse drivers of prices of digital coins during 2018. Some other applications were rejected, but this specific high profile one suffered endless delays.
Bitcoin lost the previous trough seen on November 24th, Ethereum fell below $100, and Ripple also suffered a downfall, albeit did not hit new yearly lows.
Here are the levels to watch on Bitcoin, Ethereum, and Ripple.
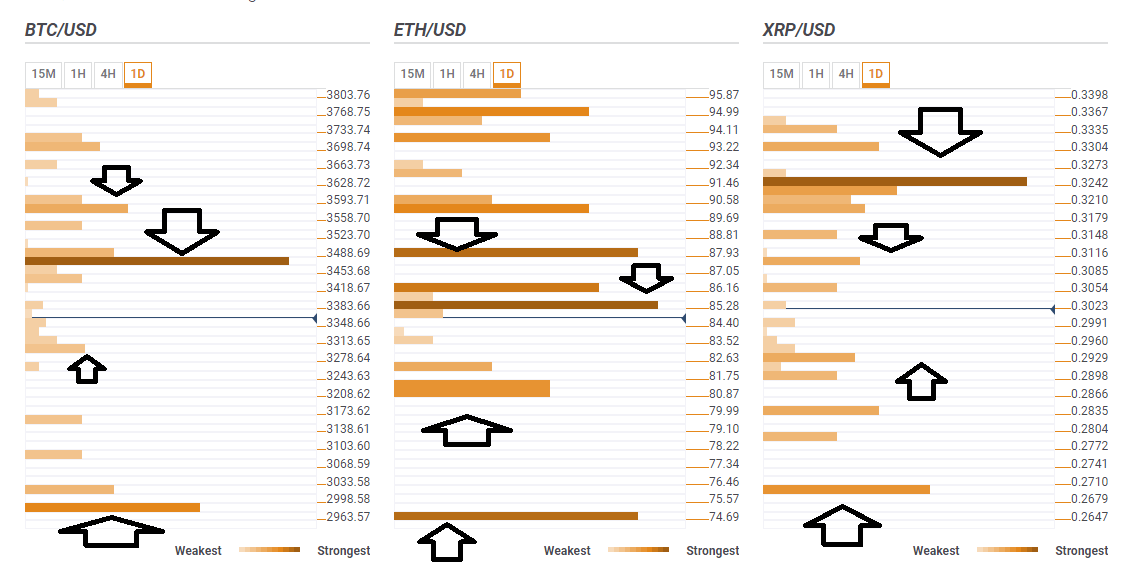
BTC/USD low point is below $3,000
The previous trough for Bitcoin was $3,456 and recorded in late November. It now turns into resistance as we see a cluster of not only the monthly lows but also the previous 4h-High, the Simple Moving Average 10-1h, the Pivot Point one-month Support 1, and the Bollinger Band 4h-Lower.
Some support awaits at around $3,295 where we see the PP one-day S1, the BB 15m-Lower, and the BB 1h-Lower.
There are several support lines spread out on the way down but the most significant level to watch is only at around $2,975 where we find last year’s low, followed by the Pivot Point one-week Support 2.
If BTC/USD overcomes $3,466, the next cap to watch is $3,580 which is the convergence of the SMA 5-4h, and the BB 1h-Middle.
ETH/USD targets $75 but has support beforehand
Ethereum has lost its second-place status and fell below $100. It faces quite a few hurdles before the round number.
$85.30 is the confluence of the Fibonacci 161.8% one-week, the SMA 5-15m, the SMA 10-15m, and it is followed closely by $86.16 where we see the PP one-day Support 3, the previous 1h-high, and the Bollinger Band 15m-Middle.
Further above, $87.93 features only one technical cap, but it is quite significant: the Pivot Point one-week Support 2.
Looking down, we see a cluster of support at around $81.20 where the Pivot Point one-day S2 and the Bolinger Band one-day Lower converge.
However, the target is much lower: at $75 we see the Pivot Point one-month Support 3.
The prospects for Vitalik Buterin’s brainchild do not look that great.
XRP/USD faces an uphill battle
Ripple has not reached the yearly lows just yet, but the digital coin faces more resistance than support.
At $0.3210 it faces a dense cluster of resistance lines including the BB 1h-Middle, the PP one-month S1, last month’s low, the SMA 5-4h, the Fibonacci 38.2% one-day, and others.
Before attempting a move on $0.3210, $0.31 is somewhat challenging as well. It includes the Bollinger Band 4h-Lower, the previous 4h-high, and the SMA 10-1h.
Looking down, $0.2929 is a support line featuring the Bollinger Band 15min-Lower, the previous 4h-Low, the Pivot Point one-day Support 1, and the BB one-day Lower.
The ultimate downside target is $0.2695 where we see the Pivot Point one-month Support 1.
Disclaimer: Foreign exchange (Forex) trading carries a high level of risk and may not be suitable for all investors. The risk grows as the leverage is higher. Investment objectives, risk appetite and ...
more

