Bitcoin At $650,000? One Stunning Chart, And Why JPMorgan Thinks Nothing Can Stop It Now
In what is JPMorgan (JPM)'s last Flows and Liquidity report for the year, quantitative analyst Nikolaos Panigirtzoglou writes that with the year coming to a close, it is useful to look at how the investment landscape changed during 2020, or said otherwise, "how have different asset classes and types of investors fared in terms of overall growth during a year dominated by the impact of the global pandemic and policy responses to it?"
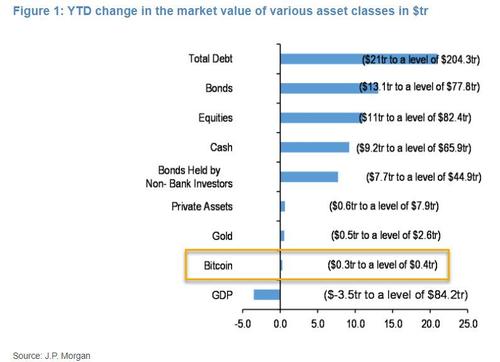
As Panigirtozglou writes in his annual look-back, the most striking increase in 2020 has been in the total outstanding debt, which in 1H20 had already increased by around $14 trillion, with the bank now projecting total debt growth for 2020 of $21 trillion, reflecting continued strong bond issuance in particular.
Of this total, the increase in bonds accounts for around $13 trillion, reflecting a significant increase in government deficits as they sought to smooth the impact on incomes as well as record corporate bond issuance, as companies sought to increase their cash buffers to weather the shock on cash flows. The remainder is a combination of bank loans, shorter-maturity paper such as bills, EM local debt, and other non-marketable debt.
That's one way of putting it - another is that in order to preserve the fiat system, central bankers had to print so much fiat that they have devalued assets by 40% in just half a year.
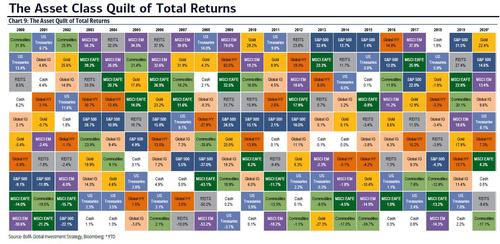
So going back to the original point, namely how have different asset classes performed, here one faces a choice: look at only conventional assets when analyzing asset returns in 2020, where the following picture emerges:
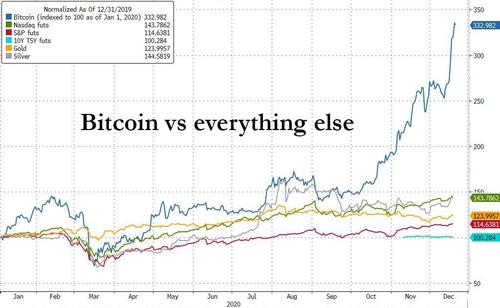
Or should one include bitcoin (BITCOMP), which has been the best performing asset by a huge margin, not only in 2020, but the past decade.
As JPM puts it, "alternative 'currencies' such as gold and bitcoin have been the main beneficiaries of the pandemic in relative terms, growing their assets (for investment purposes) by 27% and 227%, respectively."
But what is absolutely remarkable, is how small the change in the market value of bitcoin has been in order to generate such a huge return: as the stunning chart below shows, in a world that has seen the value of total bonds increase by $13.1 trillion and equities up by $11 trillion, bitcoin's amazing run took place as the market cap of bitcoin rose a paltry $0.3 trillion.
This was enough to push the price of the cryptocurrency to an all time high of $24,000 (even gold's far more muted return in 2020 was thanks to a far greater increase in gold's market value of roughly $0.5 trillion).
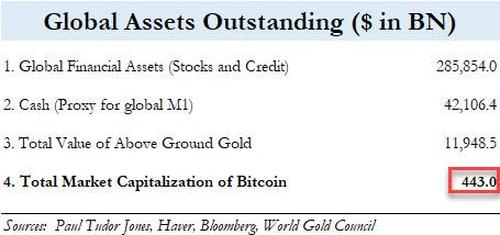
How is this possible? Simple: while global financial assets have a market cap of just below $300 trillion, and there is some $42 trillion in cash sloshing around, the value of above ground gold at $12 trillion is about 27x greater than the market cap of bitcoin today, which, at its all time high, is still just $443 billion.
In short, if the value of bitcoin were to reach parity with gold, the price of one bitcoin would have to increase to $650,000 from its current price of $24,000.
Of course, it won't get there tomorrow, but at the current rate of institutional adoption, it very well may get there sooner rather than later. The reason for that, as Panigirtzoglou writes, is that there is now just too much institutional "momentum" to "allow any position unwinding by momentum traders to create sustained negative price dynamics."
Case in point: one week ago we reported that MassMutual (MPGSX) life insurance company had invested $100 million in bitcoin for its general investment fund. This represented another milestone in bitcoin adoption, suggesting that institutional investors’ adoption of bitcoin is spilling over from family offices/HNWI to more traditional real-money investors, such as insurance companies and pension funds.
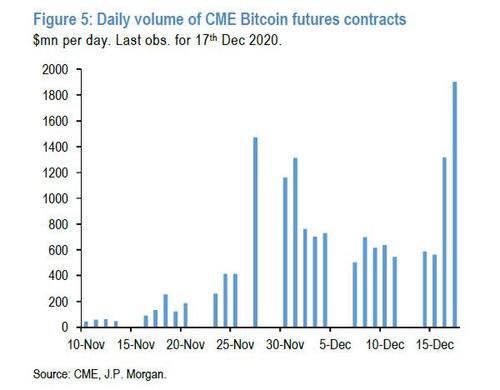
That MassMutual announcement was followed this week by a wave of speculative bitcoin buying, which according to JPMorgan, likely reflects a renewed impulse by speculative investors to front run real-money institutional investors. Indeed, bitcoin futures, the preferred vehicle of speculative investors, saw new record high volumes on Thursday this week.
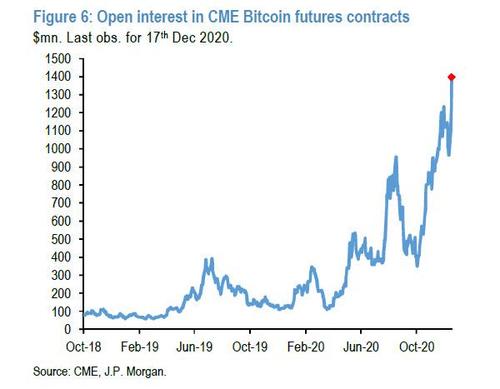
This combined with a sharp increase in open interest.
All of which points to intense buildup of futures positions. In fact, the chart above shows that the open interest of CME bitcoin futures has increased by an astonishing 45% since last Friday, more than reversing the previous decline of Nov. 25 and making a new record high of $1.4 billion.
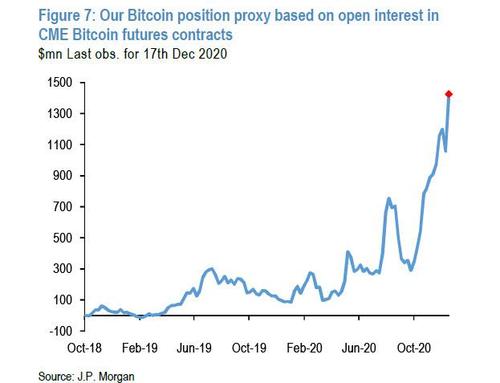
This is also true with JPMorgan's "more carefully calculated bitcoin futures position proxy" as shown below, which experienced a similarly steep ascent this week to unprecedented territory (as a reminder, JPM uses an open interest position proxy methodology which it also applies to other futures contracts, where it looks at the cumulative weekly absolute changes in the open interest multiplied by the sign of the futures price change every week).
According to the JPM analyst, "looking at Figure. 6 and Figure. 7, it is difficult to not become concerned about a buildup of speculative long futures positions in bitcoin." Yet, at the same time, even JPMorgan admits that "any previous attempts to call for mean reversion in these two indicators proved futile."
It's not just institutions and HNW/family offices rushing into cryptocurrencies; momentum traders are, too. As JPMorgan writes, "there is little doubt that momentum traders, such as CTAs and quantitative crypto funds, amplified this week’s surge."
This prompted the bank's quantitative strategist to ask "how much of vulnerability do these momentum traders pose for bitcoin at the moment," having recently argued that the near term outlook for bitcoin was skewed to the downside due to a potential decay of its momentum signals into January, unless the bitcoin resumed its uptrend by rising above $20 thousand.
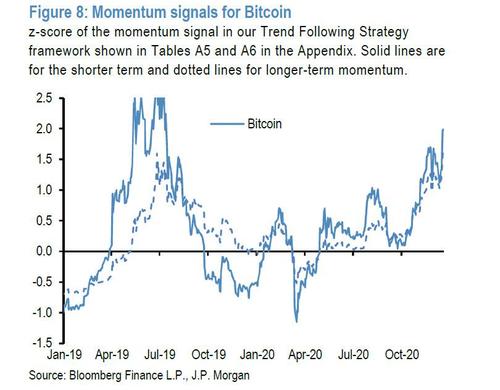
Well, that did not happen, and as Panigirtzoglou writes, "clearly this week’s surge to above $23 thousand has not only cancelled our previous momentum-signal-decay thesis, but it has reversed it by shifting these momentum signals to even higher territory." This is shown in the next chart which depicts JPM's short and long lookback period momentum signals for bitcoin:
"Figure 8 shows that the short lookback period momentum signal rose this week to 2.0 stdevs and the long lookback period to 1.6 stdevs. Both are above our 1.5stdev threshold typically associated with overbought conditions and a high risk of mean reversion. According to Figure 8 the last time momentum traders were so long bitcoin was in June 2019."
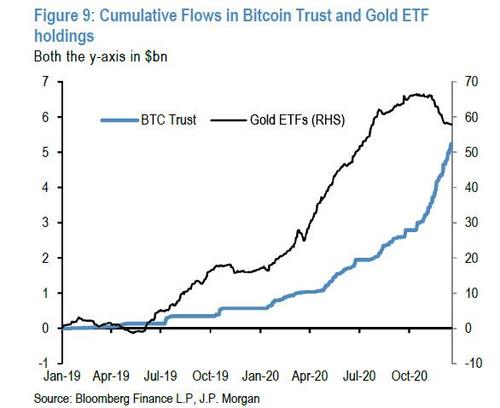
Taking the above flow data together, JPM writes that while it finds it "difficult not to characterize bitcoin as overbought at the moment," at the same time it acknowledges that "the inflows into the Grayscale Bitcoin Trust, at $1 billion per month currently are too big to allow any position unwinding by momentum traders" to create sustained negative price dynamics similar to the ones seen before in the second half of 2019.
And while there is little risk of a price reversal any time soon, JPM cautions that "monitoring on a high frequency basis the flow trajectory for the Grayscale Bitcoin Trust remains very important," as "any signs of significant slowing in the flow trajectory for the Grayscale Bitcoin Trust 9 would raise the risk of a bitcoin correction similar to the one seen in the second half of 2019."
Until that happens, however, and as long as the price momentum remains upward, a $650,000 price target - which is where the value of bitcoin would be at parity with that other "non-fiat" asset, gold - remains a distinct possibility.
Disclaimer: Copyright ©2009-2020 ZeroHedge.com/ABC Media, LTD; All Rights Reserved. Zero Hedge is intended for Mature Audiences. Familiarize yourself with our legal and use policies every time ...
more


How about buyers?? Who is gonna pony up that many $$ to buy?