

Image Source: Unsplash
- The AUD/USD is recovering into the back end of Thursday trading as risk appetite recovers.
- The Aussie knocked into 0.6385 as US Dollar flows take the AUD back into familiar territory.
- The week is set to cap off chart action with PMI figures for both Australia and the US.
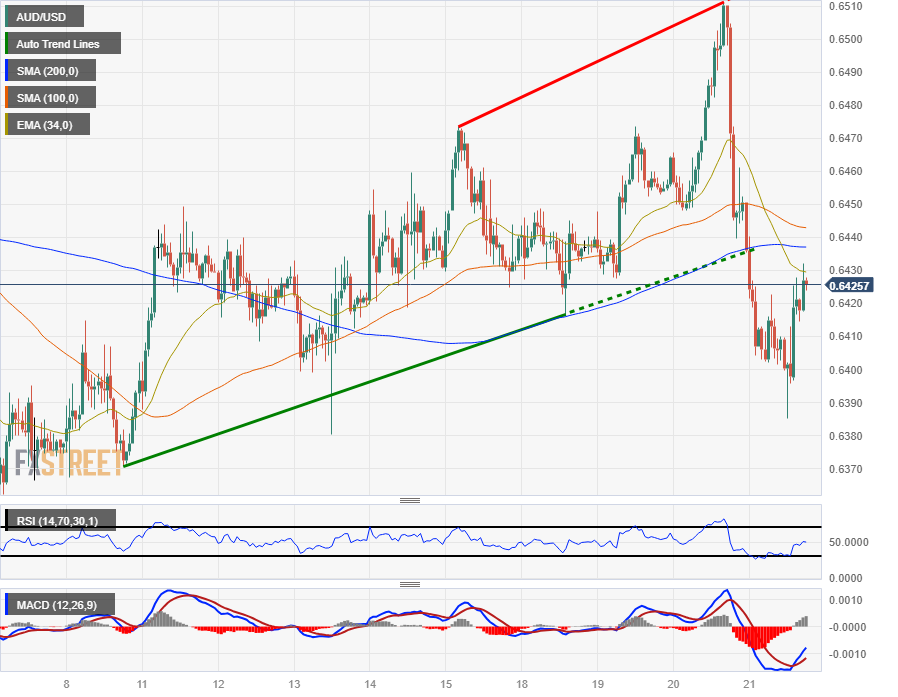
The AUD/USD is catching a bounce heading into the back end of Thursday's market session, lifting into 0.6425 after hitting a near-term low of 0.6385.
The US Dollar (USD) took a ride up the charts across the board after yesterday's Federal Reserve (Fed) which saw the US central bank hold rates steady for the time being, but an increase in the Fed's rate outlook sees markets baking in at least one more rate hike for the year.
The Federal Open Market Committee (FOMC) sees the US interest rate at 5.1% by the end of 2024, a half-percentage point higher than originally expected. The potential for higher, longer Fed rates saw the Greenback gain ground against all of its global competitors, and markets are still scrambling to correct the slide.
Australian, US PMIs on Friday to close out the trading week
Friday markets will see Purchasing Manager Index (PMI) figures for both the AUD and the USD.
The Australian Composite PMI last printed at 48, while the US Composite PMI last came in at 50.2. Purchasing managers in both economies are seeing a discrepancy in economic activity. US purchasing managers see activity and prices rising in September, while their Australian counterparts are still facing a steepening of constraint factors for the Antipodean economy.
AUD/USD technical outlook
The Aussie tumbled from a near-term peak of 0.6510 on Thursday after the Fed threw gas over the USD, and the AUD/USD fell nearly 2% before recovering from a new floor at 0.6385.
The pair has slipped below the 200-hour Simple Moving Average (SMA) near 0.6440, and fallen to the bearish side of a rising trendline on hourly candles from last week's low end near 0.6370.
On the daily candlesticks, the AUD/USD continues to fall back into familiar consolidation territory. Wednesday's backslide saw the pair cleanly reject the 34-day Exponential Moving Average (EMA), and technical support comes from recent swing lows below 0.6375.
AUD/USD hourly chart
AUD/USD technical levels
AUD/USD
| OVERVIEW | |
|---|---|
| Today last price | 0.6426 |
| Today Daily Change | -0.0022 |
| Today Daily Change % | -0.34 |
| Today daily open | 0.6448 |
| TRENDS | |
|---|---|
| Daily SMA20 | 0.643 |
| Daily SMA50 | 0.6541 |
| Daily SMA100 | 0.6611 |
| Daily SMA200 | 0.6699 |
| LEVELS | |
|---|---|
| Previous Daily High | 0.6511 |
| Previous Daily Low | 0.644 |
| Previous Weekly High | 0.6474 |
| Previous Weekly Low | 0.6378 |
| Previous Monthly High | 0.6724 |
| Previous Monthly Low | 0.6364 |
| Daily Fibonacci 38.2% | 0.6467 |
| Daily Fibonacci 61.8% | 0.6484 |
| Daily Pivot Point S1 | 0.6421 |
| Daily Pivot Point S2 | 0.6395 |
| Daily Pivot Point S3 | 0.635 |
| Daily Pivot Point R1 | 0.6493 |
| Daily Pivot Point R2 | 0.6538 |
| Daily Pivot Point R3 | 0.6564 |
More By This Author:
USD/CAD Facing Further Downside After Rejecting 1.3520UK Interest Rate Decision Preview: BoE Hike Hangs In The Balance As Inflation Cools
USD/JPY Price Analysis: Holds Steady Above 148.00, Bulls Have The Hand Near YTD Peak


Comments
Log in or sign up to join the conversation.