AUD/USD Price Forecast: Holds Position Near 0.6850, Lower Boundary Of An Ascending Channel
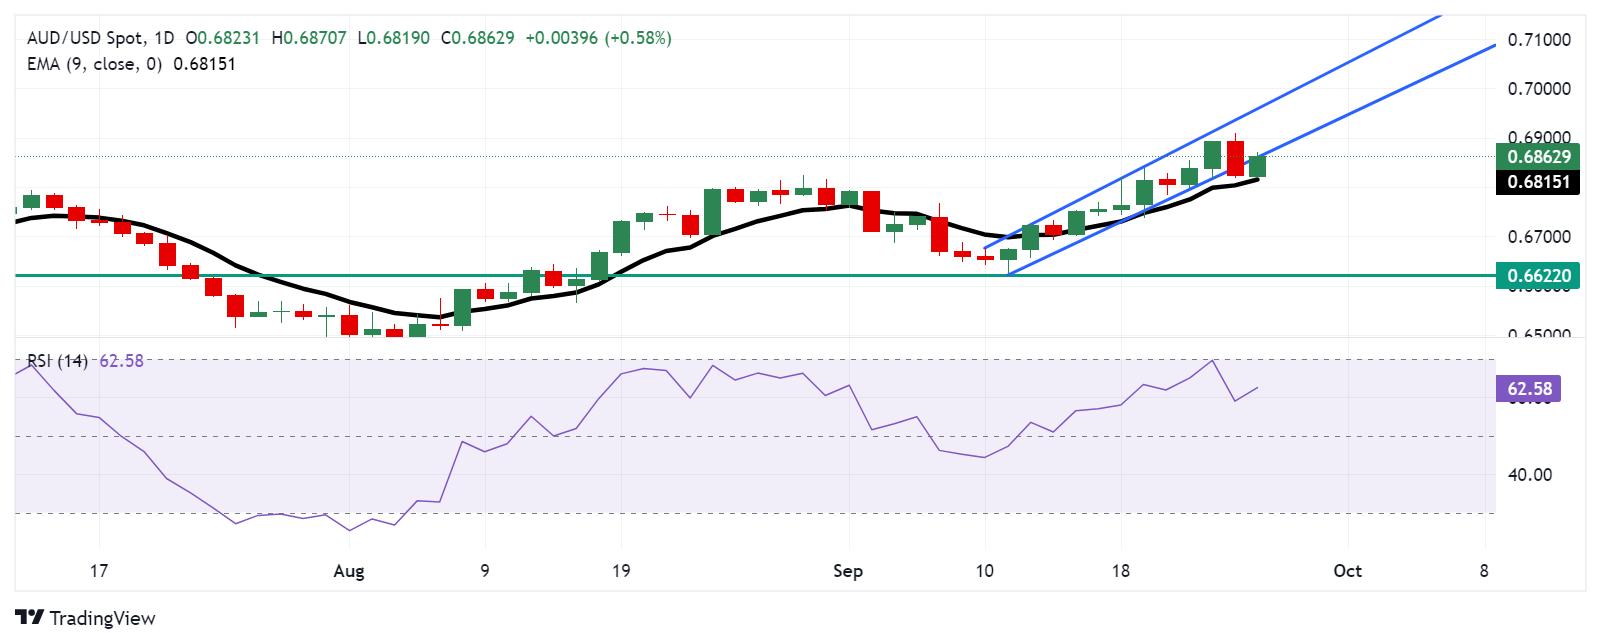
AUD/USD retraces its recent losses from the previous session, trading around 0.6860 during the European hours on Thursday. Technical analysis of the daily chart shows the pair attempting to break above the lower boundary of an ascending channel pattern. A successful return to the channel would strengthen the bullish outlook.
The 14-day Relative Strength Index (RSI) remains above the 50 level, suggesting that bullish sentiment is still intact. A further move toward the 70 level would strengthen the upside trend for the pair.
On the upside, the AUD/USD pair is testing the lower boundary of the ascending channel at the 0.6860 level. A successful rebound into the channel would provide support for the pair to move toward the upper boundary, located around the 0.6960 level.
In terms of support, the AUD/USD pair may find immediate support at the nine-day Exponential Moving Average (EMA) around the 0.6815 level. The next key support level is the psychological barrier at 0.6700. A drop below this level could drive the pair further down toward its six-week low of 0.6622, which was recorded on September 11.
AUD/USD: Daily Chart
(Click on image to enlarge)
Australian Dollar PRICE Today
The table below shows the percentage change of Australian Dollar (AUD) against listed major currencies today. Australian Dollar was the strongest against the Japanese Yen.
| USD | EUR | GBP | JPY | CAD | AUD | NZD | CHF | |
|---|---|---|---|---|---|---|---|---|
| USD | -0.12% | -0.21% | 0.01% | -0.14% | -0.59% | -0.36% | -0.13% | |
| EUR | 0.12% | -0.09% | 0.11% | -0.02% | -0.46% | -0.24% | -0.01% | |
| GBP | 0.21% | 0.09% | 0.19% | 0.08% | -0.37% | -0.17% | 0.09% | |
| JPY | -0.01% | -0.11% | -0.19% | -0.11% | -0.60% | -0.38% | -0.13% | |
| CAD | 0.14% | 0.02% | -0.08% | 0.11% | -0.44% | -0.22% | 0.02% | |
| AUD | 0.59% | 0.46% | 0.37% | 0.60% | 0.44% | 0.23% | 0.46% | |
| NZD | 0.36% | 0.24% | 0.17% | 0.38% | 0.22% | -0.23% | 0.24% | |
| CHF | 0.13% | 0.00% | -0.09% | 0.13% | -0.02% | -0.46% | -0.24% |
The heat map shows percentage changes of major currencies against each other. The base currency is picked from the left column, while the quote currency is picked from the top row. For example, if you pick the Australian Dollar from the left column and move along the horizontal line to the US Dollar, the percentage change displayed in the box will represent AUD (base)/USD (quote).
More By This Author:
USD/CHF Holds Position Around 0.8500 Ahead Of SNB Interest Rate DecisionAustralian Dollar Receives Support From Divergent Policy Outlooks Between Central Banks
USD/CAD Remains Subdued Near 1.3450 As Traders Expect More Fed Rate Cuts In This Year
Disclosure: Information on this article contains forward-looking statements that involve risks and uncertainties. Markets and instruments profiled on this page are for informational purposes ...
more


