
- AUD/USD gaps open on Monday and declines.
- The pair is in a sideways range and will probably continue oscillating.
- Gaps have a habit of getting filled, suggesting an up leg will eventually develop within the range.
AUD/USD is falling within a range encompassed by the green (ceiling) and red (floor) dashed lines on the chart below.
AUD/USD 4-hour Chart
(Click on image to enlarge)
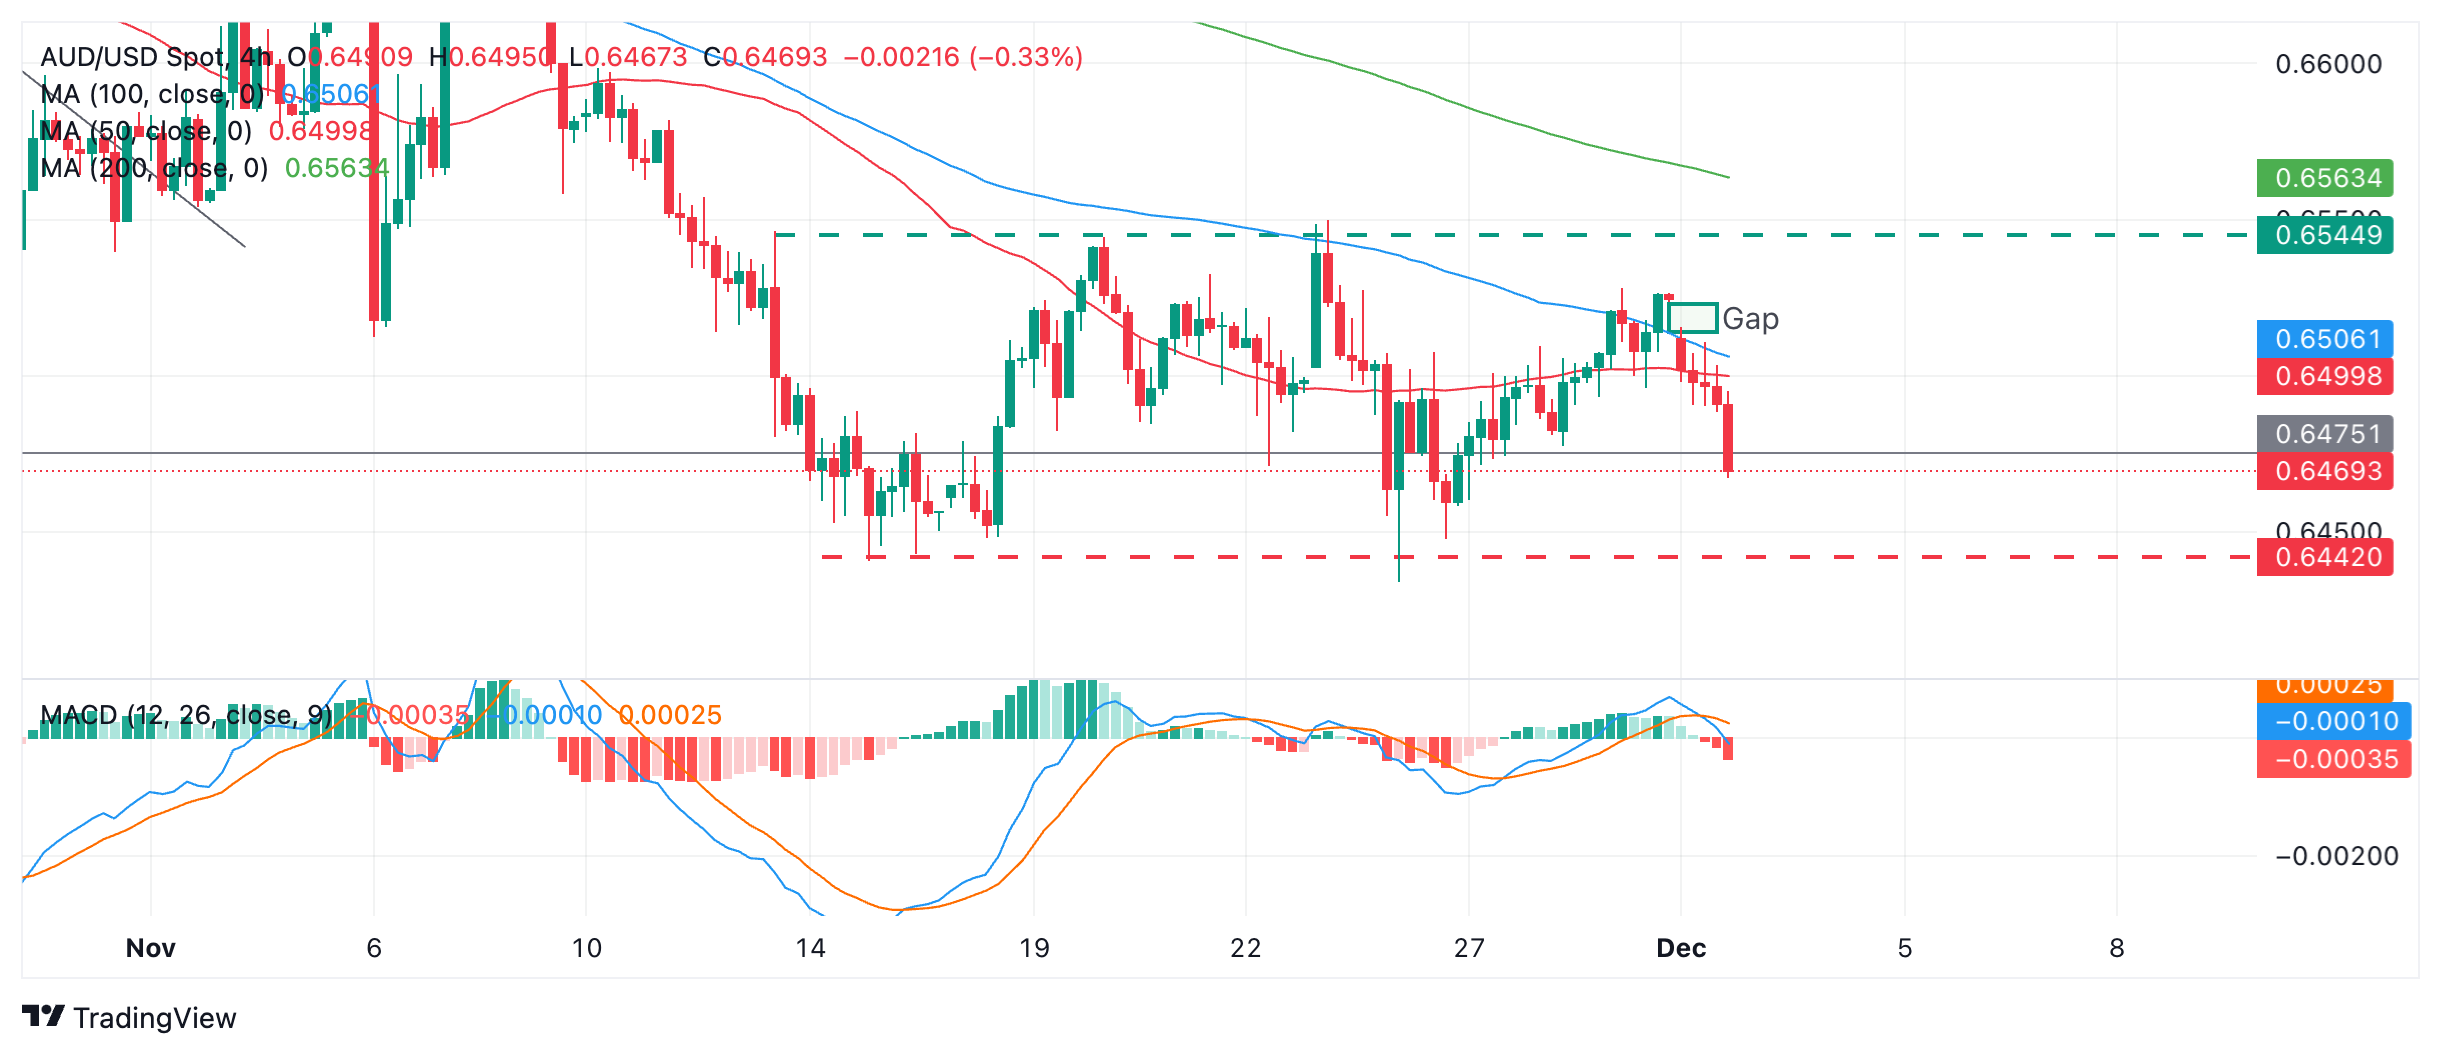
At the start of trading on Monday the pair opened a gap between between 0.6515 and 0.6524 (green rectangle). It has been selling off ever since.
AUD/USD will probably eventually fill the gap since technical analysis theory says that “the market abhors a gap”. This means gaps do not tend to remain open. When they occur within a sideways market they usually close more quickly.
It is possible the Aussie pair might fall to the region of the range lows in the 0.6440s first before recovering and filling the open gap.
Alternatively it may stop falling before it reaches the bottom of the range and recover. At the moment there are no signs of the selling letting up.
The (blue) Moving Average Convergence Divergence (MACD) indicator has crossed below its red signal line, which is a sell signal and reinforces the case for price falling towards the range lows.
More By This Author:
Pound Sterling loses 1.2700 level against US Dollar after Trump defends USD dominanceAustralian Dollar continues to gain some ground, upside may be limited
US Dollar Recovers From Daily Lows On Quiet Friday


Comments
Log in or sign up to join the conversation.