

Image Source: Unsplash
- AUD/USD attracts some selling pressure near 0.6530, losing 0.65% for the day.
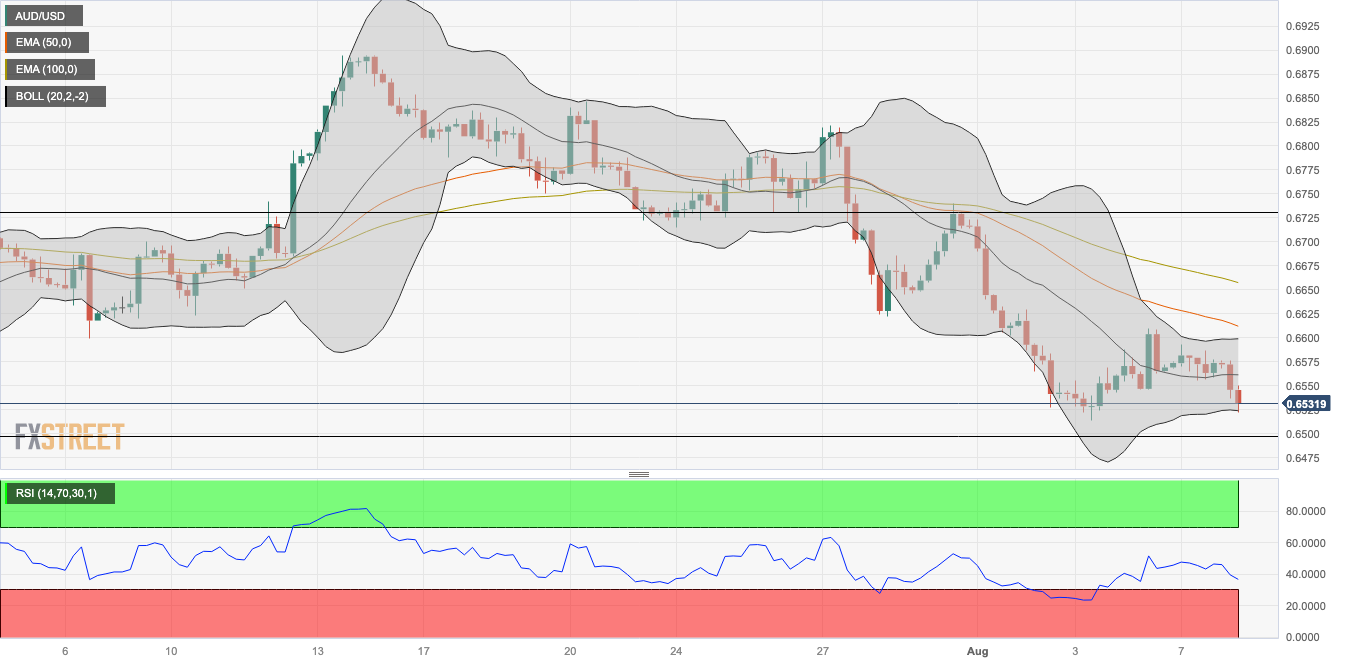
- The pair holds below the 50- and 100-hour EMAs on the four-hour chart.
- The initial support level is seen at 0.6525; 0.6560 acts as an immediate resistance level.
The AUD/USD pair remains under pressure and trades on a defensive note around the 0.6530 mark heading into the early European session on Tuesday. The prevalent US Dollar buying bias following the hawkish comment from Atlanta Federal Reserve (Fed) Governor Michelle Bowman supports the US Dollar and exerts pressure on AUD/USD. The major pair currently trades around 0.6531, losing 0.65% for the day.
Furthermore, the mixed economic reading from Australia and China joins the headline about geopolitical tension between Japan and China, exerts pressure on the China-proxy Australian Dollar (AUD), and caps the upside in the AUD/USD pair.
From a technical perspective, AUD/USD holds below the 50- and 100-hour Exponential Moving Averages (EMAs) on the four-hour chart, which means further downside looks favorable for the time being.
That said, any intraday pullback below 0.6525 (the lower limit of the Bollinger Band) would expose the next contention level in the 0.6490 area (Low of May 26). Further south, the next stop of the AUD/USD is located at 0.6460 (Low of May 31) and finally at 0.6400 (the confluence of a psychological round figure and the low of Nov 2022).
Looking at the upside, some follow-through buying towards the upper boundary of the Bollinger Band around 0.6560 will see a rally to the next barrier at the 0.6600–0.6610 zone. The mentioned level highlights the confluence of a psychological round figure and a 50-hour EMA. Following that, AUD/USD has room to test the additional upside filter at 0.6655 (the 100-hour EMA) en route to 0.6700 (High of July 31, round figure).
The Relative Strength Index (RSI) stands below 50, challenging the pair’s immediate downside for the time being.
AUD/USD four-hour chart
(Click on image to enlarge)
AUD/USD
| OVERVIEW | |
|---|---|
| Today last price | 0.653 |
| Today Daily Change | -0.0044 |
| Today Daily Change % | -0.67 |
| Today daily open | 0.6574 |
| TRENDS | |
|---|---|
| Daily SMA20 | 0.6716 |
| Daily SMA50 | 0.6702 |
| Daily SMA100 | 0.6688 |
| Daily SMA200 | 0.6734 |
| LEVELS | |
|---|---|
| Previous Daily High | 0.6593 |
| Previous Daily Low | 0.6555 |
| Previous Weekly High | 0.674 |
| Previous Weekly Low | 0.6514 |
| Previous Monthly High | 0.6895 |
| Previous Monthly Low | 0.6599 |
| Daily Fibonacci 38.2% | 0.6579 |
| Daily Fibonacci 61.8% | 0.657 |
| Daily Pivot Point S1 | 0.6555 |
| Daily Pivot Point S2 | 0.6536 |
| Daily Pivot Point S3 | 0.6517 |
| Daily Pivot Point R1 | 0.6593 |
| Daily Pivot Point R2 | 0.6612 |
| Daily Pivot Point R3 | 0.663 |
More By This Author:
WTI Slumps On Soft Demand From US And China As Traders Brace For US CPISilver Price Analysis: XAG/USD Plunged Below The 100-day SMA As The USD Recovers
USD/JPY Climbs On Strong USD After Last Week’s US Nonfarm Payrolls Data


Comments
Log in or sign up to join the conversation.