AUD/USD Forex Signal: Set To Hit 0.6700 Ahead Of The US Inflation Data
Bullish view
- Buy the AUD/USD pair and set a take-profit at 0.6700.
- Add a stop-loss at 0.6500.
- Timeline: 1-3 days.
Bearish view
- Sell the AUD/USD pair and set a take-profit at 0.6500.
- Add a stop-loss at 0.6700.
(Click on image to enlarge)
The AUD/USD exchange rate wavered as traders focused on the upcoming US consumer price index (CPI) data, which may help to determine what the Federal Reserve will do in the next meeting. It was trading at 0.6585, a few points below this week's high of 0.6623.
US Inflation Data and Federal Reserve Decision
The AUD/USD exchange rate wavered as traders waited for the August producer and consumer inflation data.
Economists polled by Reuters expect the upcoming data to show that the core producer price index (PPI) dropped from 3.7% in July to 3.5% in August. The headline PPI is expected to come in at 3.3% from, up from the previous 3.2%.
The US will publish the closely-watched consumer inflation data on Thursday. Economists see the numbers showing that the headline CPI rose from 2.7% in July to 2.9% in August. These numbers will mean that Trump's tariffs were having an impact on inflation.
Still, most economists expect the data to show that the Federal Reserve will cut interest rates in the upcoming meeting on Wednesday next week.
It will cut interest rates because of the weak labor market. A report released last week showed that the economy created just 22,000 jobs in August as the unemployment rate rose to 4.3%. Another report showed that the economy had fewer jobs on payrolls than expected in the 12 months to March this year.
The Reserve Bank of Australia (RBA) is expected to either cut interest rates or leave them unchanged in the next monetary policy meeting.
AUD/USD Technical Analysis
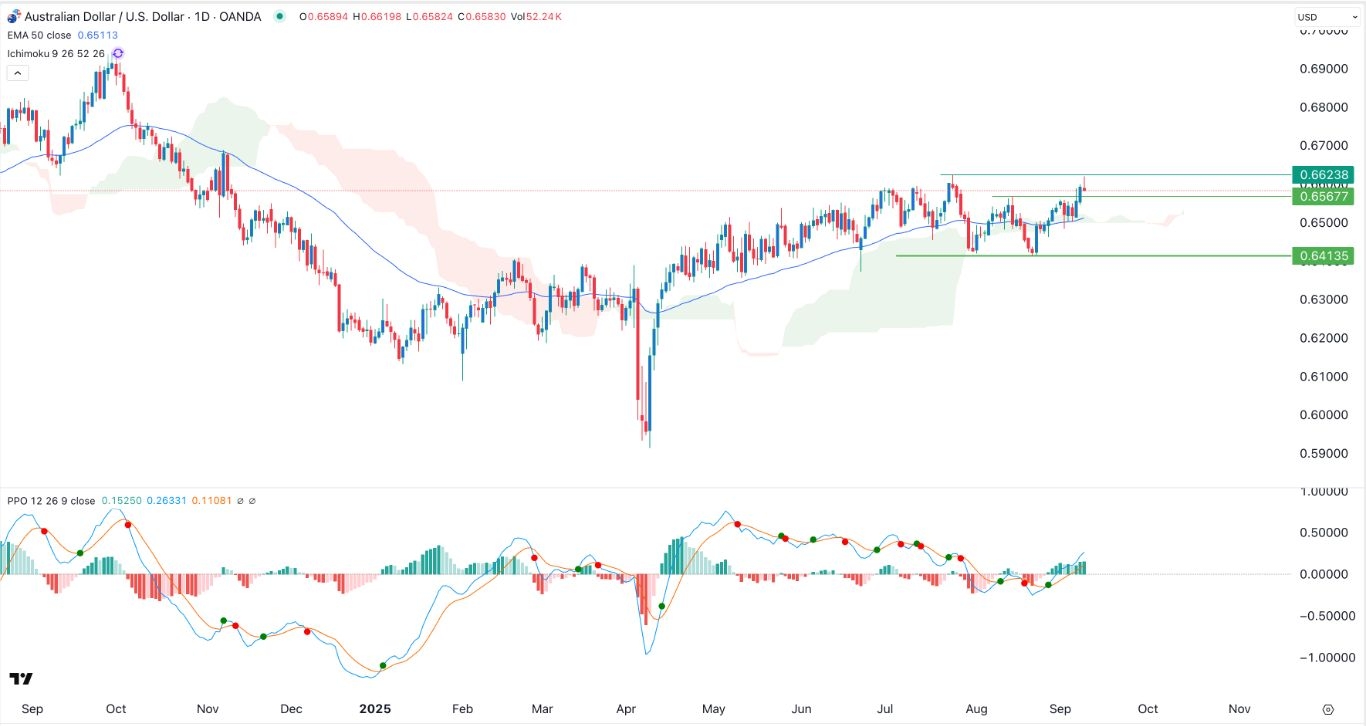
The daily timeframe chart shows that the AUD/USD pair was trading at 0.6580, a few pips below this week's high of 0.6623. Its highest level this week was notable as it was the highest point in June. It was its highest level this year.
The pair formed a double-top pattern at 0.6413 and has already moved above the key resistance level at 0.6567, its neckline. It has remained above the 50-day moving average and the Ichimoku cloud indicator.
The two lines of the Percentage Price Oscillator (PPO) have continued rising in the past few days. Therefore, the pair will likely surge above the year-to-date high of 0.6628 and hit the psychological level at 0.6700.
More By This Author:
IREN Stock Price Forecast: Is It A Good AI Infrastructure Play?GBP/USD Forex Signal - Bullish Outlook Ahead Of US Inflation Data
EUR/USD Forex Signal: Set To Hit YTD High Ahead Of Key Events
Risk Disclaimer: DailyForex will not be held liable for any loss or damage resulting from reliance on the information contained within this website including market news, analysis, trading signals ...
more


