AUD/USD Forex Signal: Inverse Head And Shoulders Pattern Forms
Bullish view
- Buy the AUD/USD pair and set a take-profit at 0.6668.
- Add a stop-loss at 0.6545.
- Timeline: 1-2 days.
Bearish view
- Set a sell-stop at 0.6585 and a take-profit at 0.6500.
- Add a stop-loss at 0.6660.
(Click on image to enlarge)
The US dollar rebounded against the Aussie after the strong US consumer inflation report. The AUD/USD pair dropped below the support at 0.6600 as traders assessed the next actions by the Federal Reserve.
US inflation complicates Fed action
The AUD/USD pair retreated after the US published strong inflation numbers. The headline, core, and supercore inflation figures were higher than expected. Inflation rose by 3.2% in February while the core CPI, which excludes the volatile food and energy prices rose by 3.8%.
These numbers are complicating the next actions by the Federal Reserve. In December, the Fed hinted that the first interest rate cut would come in March of this year. The bank then ruled hinted that a cut would not happen in March.
Therefore, there is a likelihood that the Fed will not start cutting interest rates in the first half of the year. It will also deliver fewer cuts than expected since inflation remains stubbornly above its two percent target.
This explains why the US dollar and bond yields bounced back. The US dollar index rose to $102.60 while the 10-year and 30-year yields rose to 4.15% and 4.32%, respectively.
Complicating the issue is the fact that the American economy is showing signs that the economy is slowing. Consumer confidence has dropped, which could affect spending and retail sales. Factory orders and durable goods orders have also pulled back sharply.
The AUD/USD pair also retreated as concerns about the iron ore market continued. Iron ore, a key Australian export, has dropped sharply as China’s steel mills slash production.
The Price has dropped by more than 8% this week to $107.7 and has shed over a quarter of its value since January. Its price action in the iron ore market is important because it is Australia’s biggest export.
AUD/USD technical analysis
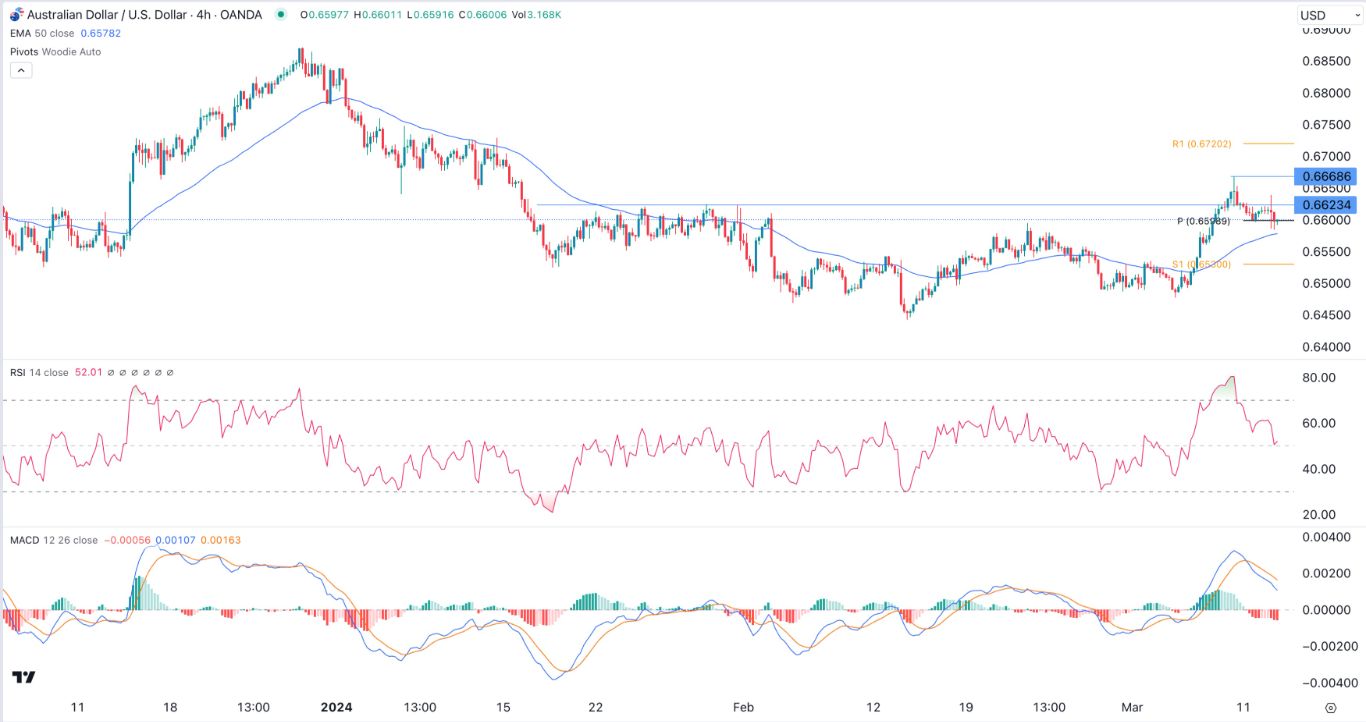
The AUD/USD pair peaked at 0.6668 on Friday last week and formed a doji pattern. It has now retreated and moved to the Woodie pivot point at 0.6600. The pair has remained slightly above the 50-period Exponential Moving Average (EMA).
Further, key oscillators like the Relative Strength Index (RSI) and the MACD have pointed downwards. A closer look shows that it has formed an inverse head and shoulders pattern.
Therefore, the pair will likely bounce back as buyers target last week’s high of 0.6668. A drop below the 50-period moving average will invalidate the bullish view.
More By This Author:
BTC/USD Forex Signal: Bitcoin Price Could Hit $75k This WeekEUR/USD Forex Signal: More Upside Ahead Of ECB Decision, NFP Data
EUR/USD Forex Signal: Extremely Bullish Ahead Of ECB Decision
Risk Disclaimer: DailyForex will not be held liable for any loss or damage resulting from reliance on the information contained within this website including market news, analysis, trading signals ...
more


