AUD/USD Forex Signal - Bearish Outlook Ahead Of RBA Decision
Bearish view
- Sell the AUD/USD pair and set a take-profit at 0.6420.
- Add a stop-loss at 0.6600.
- Timeline: 1-2 days.
Bullish view
- Buy the AUD/USD pair and set a take-profit at 0.6600.
- Add a stop-loss at 0.6420.
(Click on image to enlarge)
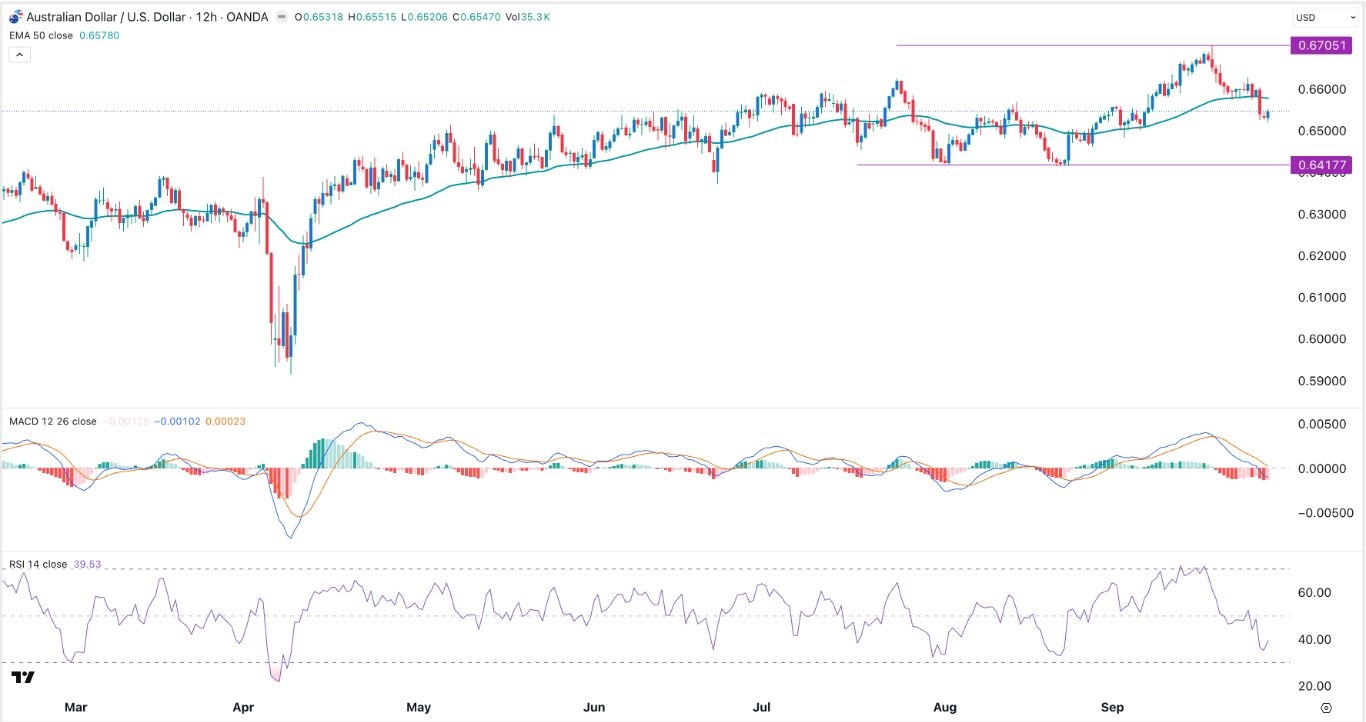
The AUD/USD exchange rate pulled back to its lowest level since September 5 as focus shifts to the upcoming Reserve Bank of Australia (RBA) and US nonfarm payrolls (NFP) data. It dropped to a low of 0.6547, down by 2.38% from its highest point this year.
RBA Interest Rate Decision and US Jobs Data
The AUD/USD pair retreated as traders waited for the closely-watched RBA interest rate decision. Economists polled by Reuters expect the bank to leave interest rates unchanged at 3.60%.
The Michele Bullock-led central bank will do that because of the fairly strong labor market, and as officials wait for more signs about inflation.
Odds of a cut in this meeting fell after the statistics agency published the monthly inflation report. This report showed that the headline consumer price index (CPI) rose 3.0% in August from 2.8% in the previous month.
As such, the tight labor market and higher inflation means that officials can afford to wait. Still, most analysts believe that the bank will cut rates in the November meeting.
The other main catalyst for the AUD/USD exchange rate will be from the United States, which will publish several important numbers this week.
One of the key numbers will come out on Tuesday when the Conference Board publishes the latest consumer confidence report. This is a key number because of the important role that consumer spending plays on the economy.
The most important numbers will be the ADP and the BLS jobs numbers for September. These are crucial reports because the Federal Reserve is now focusing on the US labor market, which has softened substantially in the past few months.
The most recent report showed that the economy created just 22k jobs in August, while the unemployment rate continued to tick upwards.
AUD/USD Technical Analysis
The 12-hour chart shows that the AUD/USD exchange rate has pulled back in the past few days. It has dropped from a high of 0.6705 on Sep. 17 to 0.6547 today.
The pair has moved slightly below the 50-period Exponential Moving Average. In most cases, falling below that level is a sign that bears have prevailed.
The two lines of the MACD indicator have moved below the zero line. Also, the Relative Strength Index (RSI) has moved below 50. Therefore, the pair will likely keep falling as sellers target the key support at 0.6417.
More By This Author:
Why Are Bitcoin Treasury Stocks Crashing In 2025?VOO And SPY ETFs: Top Stocks Driving The S&P 500 Index In 2025
As The MSTR Stock Dives, Is The 183% Yielding MSTY A Better Buy?
Risk Disclaimer: DailyForex will not be held liable for any loss or damage resulting from reliance on the information contained within this website including market news, analysis, trading signals ...
more


