
- The AUD/USD forecast remains neutral to bullish as safe-haven flows limit the gains while a weaker dollar supports the pair.
- Upbeat data from China and Australia strengthen the case for RBA hikes.
- Coming up, labor market data from Australia remains a key driver for the markets.
The Australian dollar struggles to find a footing around the 0.6700 level as geopolitical concerns and domestic data releases vie for attention. On the one hand, President Trump’s threat to impose 10% tariffs on eight European countries has sparked a general “risk-off” mood, hurting the US dollar and providing AUD/USD with some support. Investors have tilted toward classic safe havens like JPY and CHF, capping further gains in AUD. However, the Aussie remains stronger, being China’s proxy currency.
Speaking of China, Q4 GDP growth of 4.5% YoY, slightly above consensus, reinforces Australia’s export outlook and underpins commodity-linked currencies. Industrial production at 5.2% YoY and a 1.0% MoM surge in Australia’s TD-MI inflation gauge have added further upside bias to AUD. This suggests underlying demand pressure in the economy. Yet December retail sales came in below forecasts, underscoring lingering domestic headwinds.
Looking ahead, the local labor market report on Thursday could be the next catalyst. Consensus calls for a 30K increase in employment and a small uptick in unemployment to 4.4%. A stronger-than-expected print could sharply lift rate-hike odds from 27% for February to 76% for May. This could drive AUD/USD toward the mid-0.6700s. Conversely, a disappointing jobs figure would reinforce RBA easing bets, risking a slide back toward 0.6660.
AUD/USD Technical Forecast: Consolidation Near Support
(Click on image to enlarge)
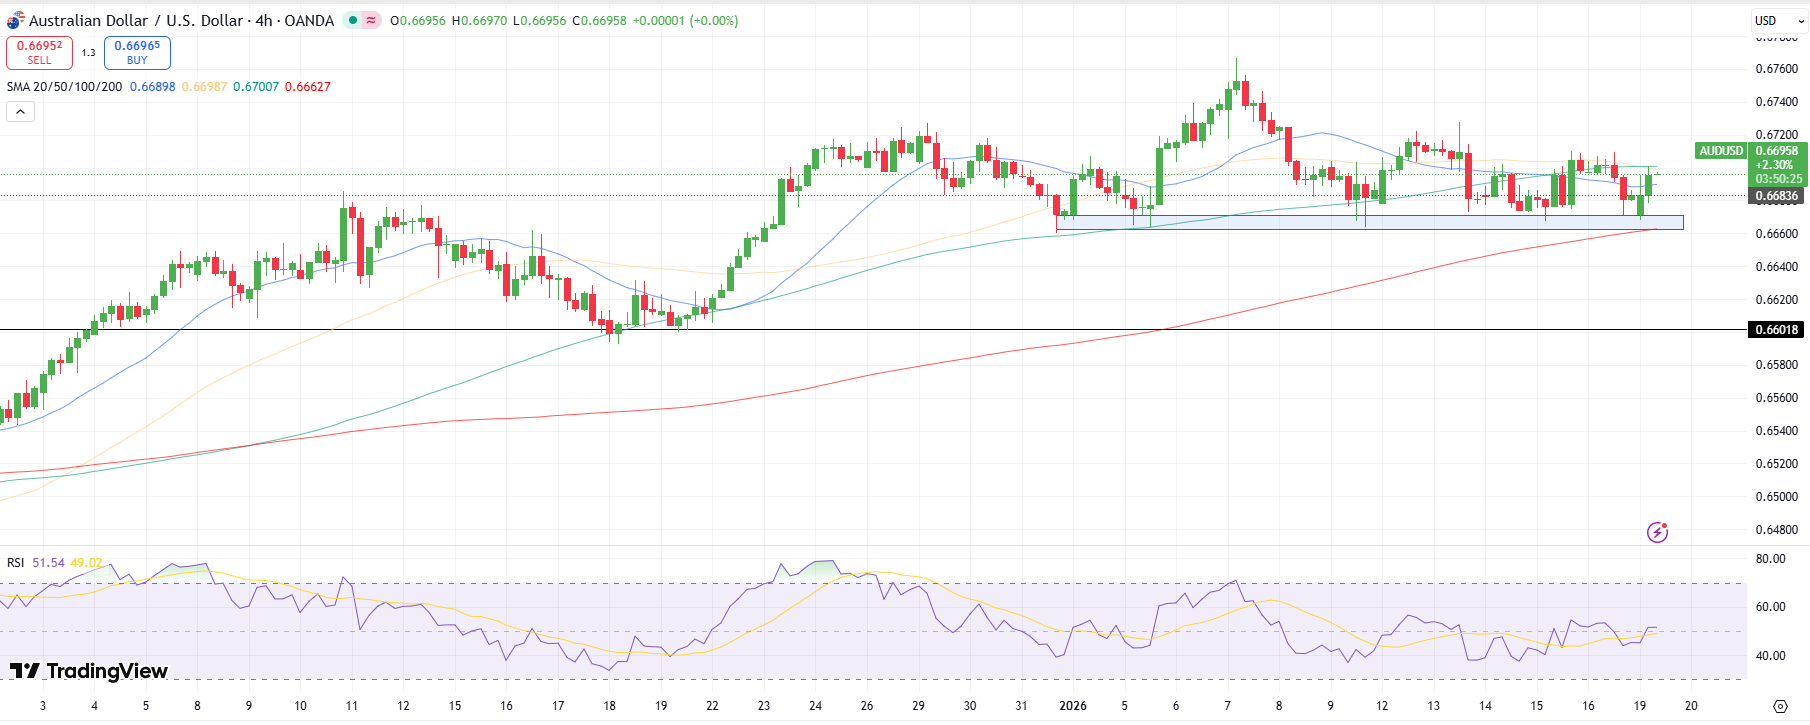
AUD/USD 4-hour chart
AUD/USD remains in a tight consolidation, staying above the 200-period MA at around 0.6670. The 0.6660-0.6670 zone provides immediate support, and the 200-period MA confluence strengthens it.
Immediate resistance appears near 0.6700, the confluence of the 100- and 50-period MAs. Also, there is significant resistance around 0.6720 and 0.6760 (swing highs). The RSI is about 51, indicating neutral momentum that could go either way.
A clear close above 0.6720 would open the path for 0.6760, while a break below 0.6660 would aim for 0.6600. In general, the chart shows a cautious bullish bias within the established range.
More By This Author:
GBP/USD Weekly Forecast: Gains Pared As Dollar Surges, Eyes On Inflation DataEUR/USD Outlook: Bears Aiming For 1.1550 Amid Fed-ECB Divergence
USD/JPY Price Analysis: Firm On Fed Rate Support Despite Equity Wobble

Comments
Log in or sign up to join the conversation.