
AUD/USD Forecast: Aussie Gains Ground Ahead Of Cautious RBA Policy Signals
- The AUD/USD forecast shows a slight boost, but is capped by a stronger greenback.
- The AUD halted its three-day losing streak as the Austrian CPI data came in stronger than expected, lifting the AUD.
- Traders look ahead to the RBA rate decision and the US ISM manufacturing PMI data for fresh impetus.
The AUD/USD forecast indicates the pair slightly rising, trading around 0.6550 as the AUD receives a small boost amid cautious Reserve Bank of Australia policies and resilient inflation reports. The AUD/USD pair broke its three-day losing streak as investors awaited the RBA meeting on Tuesday. The markets anticipate that the RBA will keep the interest rates unchanged.
The Australian inflation metrics turned out stronger than expected. The Melbourne Institute’s monthly inflation gauge climbed 0.3% MoM in October. Meanwhile, the annual rate increased to 3.1% from 3.0% in September. Building permits also exceeded forecasts as they rose 12.0% MoM in October after the previous decline.
On the other hand, in China, the RatingDog manufacturing PMI fell from 51.2 to 50.6 in September. Since Australia and China are trade-linked, this development could have weighed on the AUD. However, the stronger domestic inflation data lifted the AUD dollar.
On the US side, the dollar also witnessed a slight boost due to declining expectations of a December Fed cut, falling from 90% over a week ago to only 70% on Monday, according to the CME FedWatch tool. The US Dollar Index trades around 99.80, further lifting the dollar. However, the pair remains under mild pressure as the dollar’s strength limits the AUD’s uptrend.
AUD/USD Daily Key Events
The major events in the day include
- US ISM Manufacturing PMI
- US ISM Manufacturing Prices
On Monday, traders look forward to the ISM manufacturing PMI and ISM manufacturing prices for economic and inflation trends, as these could give insight into Fed policy expectations.
AUD/USD Technical Forecast: Stays Range-bound, Eyes Break Above 200-MA
(Click on image to enlarge)
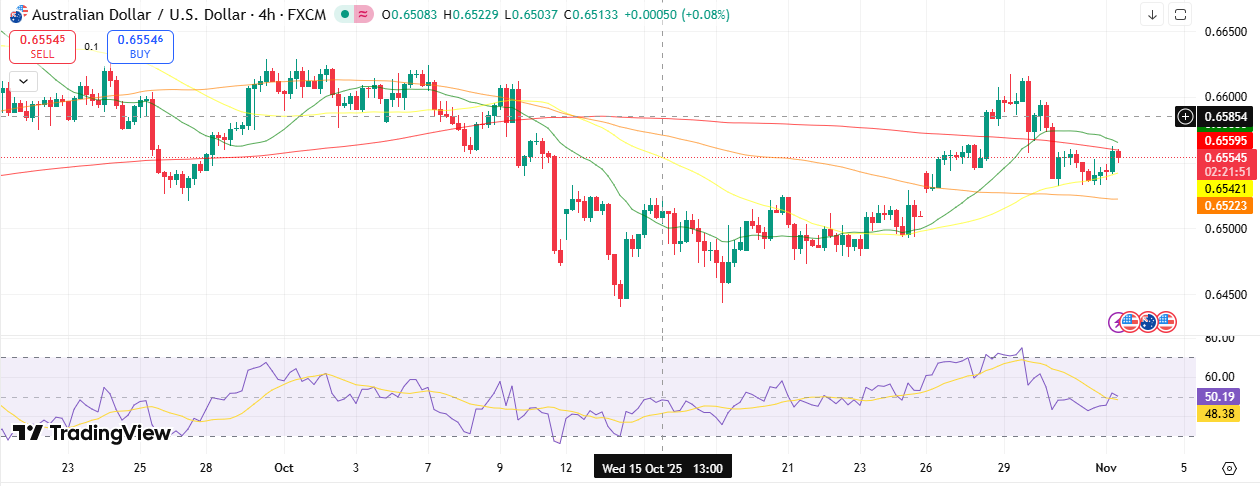
AUD/USD 4-hour chart
The AUD/USD 4-hour chart suggests the pair is trading around the 0.6550 level, signaling mild upside momentum after an earlier rebound from 0.6500. The price is above the 20- and 50-period MAs, suggesting a near-term recovery. However, the pair is slightly below the 200-period MA around 0.6560, near the immediate resistance zone.
The RSI at 50 signals indecision between buyers and sellers. A decisive break above the 0.6580 level could open room for further upside. Conversely, a break below the 0.6520 level could trigger a downside towards 0.6500.
Support Levels
- 0.6520
- 0.6500
- 0.6475
Resistance Levels
- 0.6560
- 0.6585
- 0.6620
More By This Author:
AUD/USD Weekly Forecast: Cautious Fed Weighs On Aussie, Eying NFPGBP/USD Forecast: Sellers Aiming for 1.3000 As BoE-Fed Divergence Plays
EUR/USD Outlook: Bears Sustain Amid Steady ECB, Fed’s Cautiousness
Disclaimer: Foreign exchange (Forex) trading carries a high level of risk and may not be suitable for all investors. The risk grows as the leverage is higher. Investment objectives, risk ...
more

