

Image Source: Unsplash
- The AUD/USD has rebounded from recent lows, pushed higher by a retreating US Dollar.
- Australian economic data remains on the weak side, but broader market flows are determining direction.
- Markets are looking ahead to US PCE inflation figures on Friday.
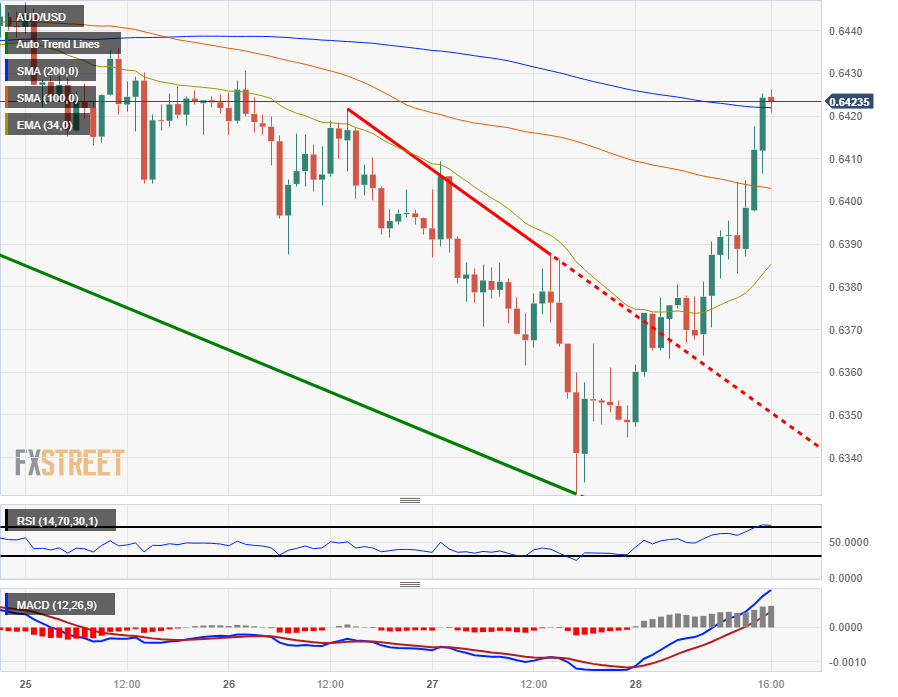
The AUD/USD has caught a much-needed bounce from near-term lows around 0.6340, and the pair is up over 1% after reclaiming the 0.6400 handle in Thursday trading. The Aussie-Dollar pairing is currently taking a breather and marking in territory near 0.6420.
Australian Retail Sales came in below expectations early Thursday, printing at a seasonally adjusted 0.2% for the month of August. The previous reading saw 0.5%, and the actual headline figure failed to meet market forecasts of 0.3%.
US data came in mixed on Thursday, with Gross Domestic Product (GDP) hitting the middle of expectations.
US GDP for the second quarter printed as expected at 2.1% over the previous quarter; Initial Jobless Claims improved slightly, from 202K to 204K.
The downside came from US Pending Home Sales for August, which clocked in an abysmal -7.1%, far below the forecast -0.8% and a complete reversal from the previous print of 0.9%.
All that's left on the economic calendar data docket for the US Dollar is Friday's Personal Consumption Expenditure (PCE) Price Index. August's PCE is forecast to hold steady at 0.2%.
AUD/USD technical outlook
The Aussie broke loose from recent intraday bearish action, jumping up a full percentage point to ping against the 200-hour Simple Moving Average near 0.6420.
Near-term technical resistance sits at the last swing high last week near 0.6460, and bidders will be looking to catch support from the 100-hour SMA currently drifting into the 0.6400 handle.
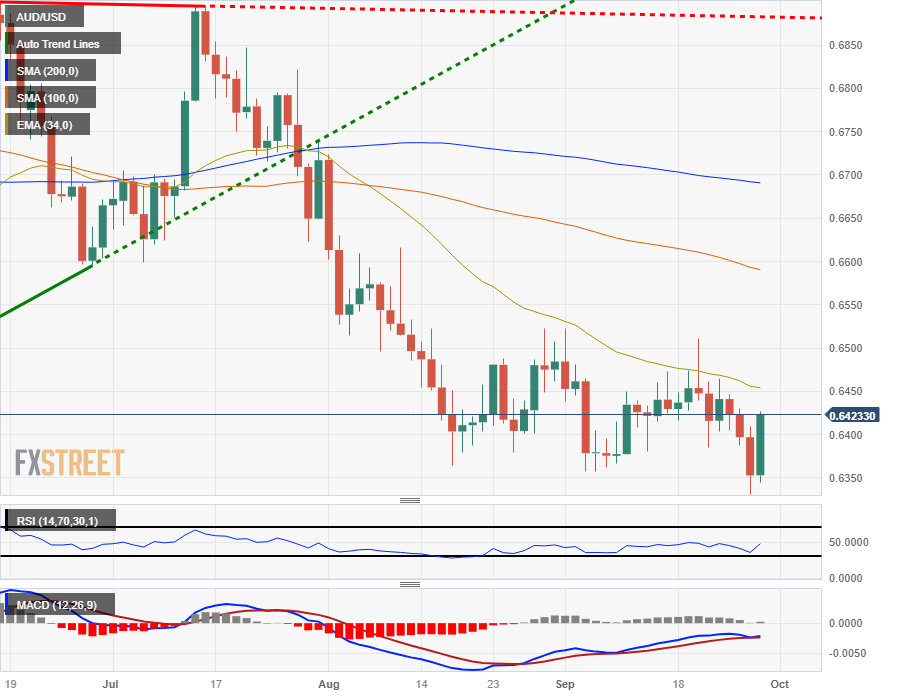
The overall trend still remains firmly bearish, and the AUD/USD remains well off recent highs on the daily candlesticks. Price action will see resistance from the 34-day Exponential Moving Average (EMA) just north of 0.6450, while downside momentum will see a support zone baked in at recent swing lows between 0.6400 and 0.6350.
AUD/USD hourly chart
(Click on image to enlarge)
AUD/USD daily chart
(Click on image to enlarge)
AUD/USD technical levels
AUD/USD
| OVERVIEW | |
|---|---|
| Today last price | 0.6421 |
| Today Daily Change | 0.0068 |
| Today Daily Change % | 1.07 |
| Today daily open | 0.6353 |
| TRENDS | |
|---|---|
| Daily SMA20 | 0.6422 |
| Daily SMA50 | 0.6499 |
| Daily SMA100 | 0.6593 |
| Daily SMA200 | 0.6692 |
| LEVELS | |
|---|---|
| Previous Daily High | 0.6409 |
| Previous Daily Low | 0.6332 |
| Previous Weekly High | 0.6511 |
| Previous Weekly Low | 0.6385 |
| Previous Monthly High | 0.6724 |
| Previous Monthly Low | 0.6364 |
| Daily Fibonacci 38.2% | 0.6361 |
| Daily Fibonacci 61.8% | 0.638 |
| Daily Pivot Point S1 | 0.632 |
| Daily Pivot Point S2 | 0.6287 |
| Daily Pivot Point S3 | 0.6242 |
| Daily Pivot Point R1 | 0.6398 |
| Daily Pivot Point R2 | 0.6442 |
| Daily Pivot Point R3 | 0.6475 |
More By This Author:
EUR/USD Price Analysis: Struggles To Halt The Losing Streak Near 1.0500USD/CAD Trades Below 1.3500, Faces Pressure Due To Upbeat Crude Oil Prices
GBP/USD Price Analysis: Remains Under Selling Pressure, The Key Contention Is Seen At 1.2100


Comments
Log in or sign up to join the conversation.