

Image Source: Unsplash
- The AUD/NZD is softening up this week, sifting back into the 1.0700 handle.
- The Aussie's jumpstart last week failed to materialize any meaningful bullish momentum.
The AUD/NZD has settled back steadily this week, slipping away from last week's late swing high into 1.0750. The Aussie (AUD) is broadly lower on the week, shedding weight against the rest of the major currencies.
The AUD/NZD has spent most of 2023 cycling in rough sideways churn, rotating between boundaries roughly between 1.0950 and 1.0650.
The AUD/NZD has been stuck to the 200-hour Simple Moving Average (SMA) ever since rising into the high side of intraday action last week, but the pair's bullish recovery appears to have been cut short as the Aussie waffles against the Kiwi.
The AUD is down over two and a quarter percent from early November's peak near 1.0940, hitting a swing low within reaching distance of October's bottom bids of 1.0625.
A bullish reversal ran into a hard wall at 1.0750 last Friday, and the pair has steadily deflated ever since, threatening to destabilize back into lows near 1.0660.
Australian Dollar price this week
The table below shows the percentage change of the Australian Dollar (AUD) against listed major currencies this week. The Australian Dollar was the strongest against the Japanese Yen.
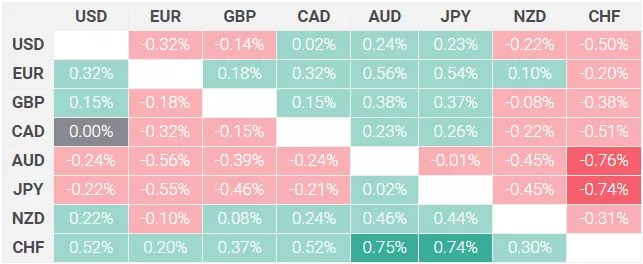
The heat map shows percentage changes of major currencies against each other. The base currency is picked from the left column, while the quote currency is picked from the top row. For example, if you pick the Euro from the left column and move along the horizontal line to the Japanese Yen, the percentage change displayed in the box will represent EUR (base)/JPY (quote).
AUD/NZD Hourly Chart

AUD/NZD Daily Chart

AUD/NZD Technical Levels
AUD/NZD
| OVERVIEW | |
|---|---|
| Today last price | 1.0697 |
| Today Daily Change | -0.0025 |
| Today Daily Change % | -0.23 |
| Today daily open | 1.0722 |
| TRENDS | |
|---|---|
| Daily SMA20 | 1.0788 |
| Daily SMA50 | 1.0791 |
| Daily SMA100 | 1.0809 |
| Daily SMA200 | 1.08 |
| LEVELS | |
|---|---|
| Previous Daily High | 1.0748 |
| Previous Daily Low | 1.071 |
| Previous Weekly High | 1.0768 |
| Previous Weekly Low | 1.066 |
| Previous Monthly High | 1.0944 |
| Previous Monthly Low | 1.0723 |
| Daily Fibonacci 38.2% | 1.0725 |
| Daily Fibonacci 61.8% | 1.0734 |
| Daily Pivot Point S1 | 1.0706 |
| Daily Pivot Point S2 | 1.0689 |
| Daily Pivot Point S3 | 1.0668 |
| Daily Pivot Point R1 | 1.0744 |
| Daily Pivot Point R2 | 1.0765 |
| Daily Pivot Point R3 | 1.0782 |
More By This Author:
Silver Price Analysis: XAG/USD Struggles At 50-DMA And Slumps Below $23.00GBP/USD Remains Steady Around 1.2550 With All Eyes On US CPI
Gold Price Remains On The Defensive Ahead Of US CPI Data


Comments
Log in or sign up to join the conversation.