Silver Price Analysis: XAG/USD Struggles At 50-DMA And Slumps Below $23.00

Image Source: Pixabay
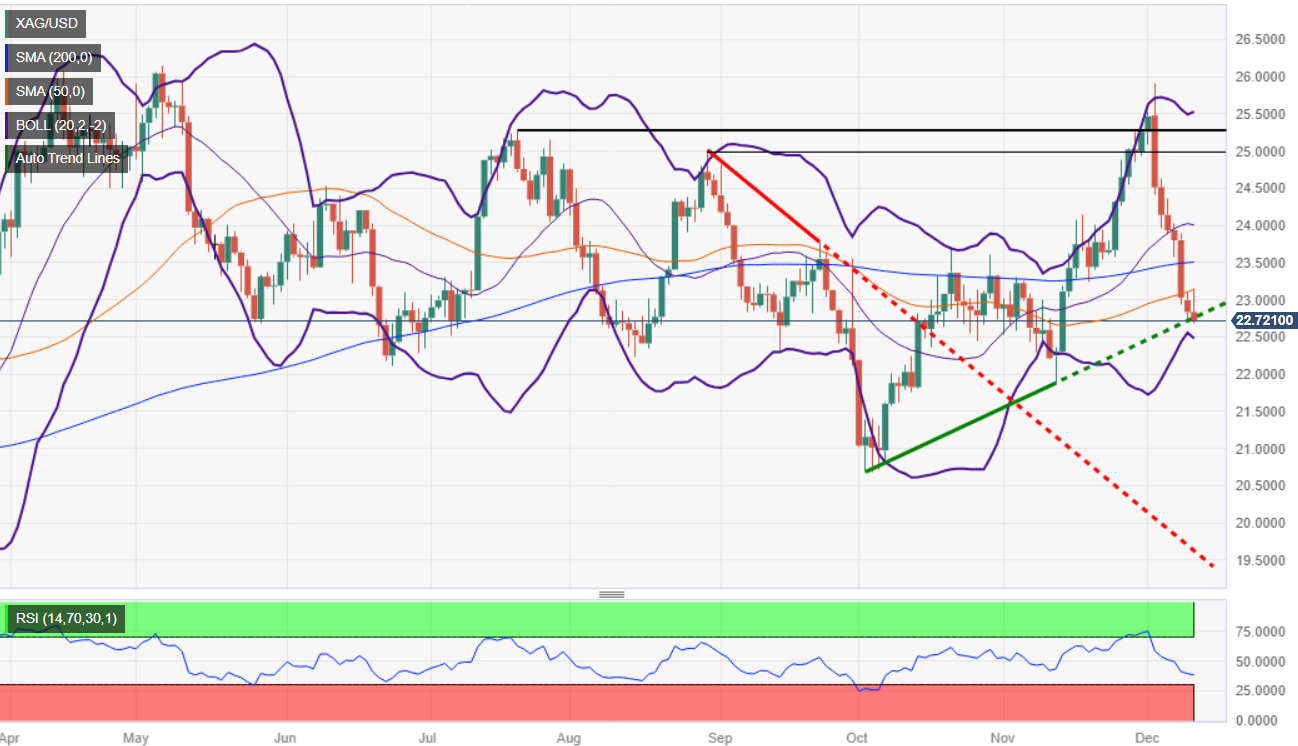
Silver price erased earlier gains and turned negative, down 0.30% following a softer US inflation report, which initially bolstered XAG/USD prices. Nevertheless, as US Treasury bond yields pared its losses, the grey metal lost its shine. The XAG/USD is trading at $22.74, retesting a two-month-old support trendline.
Silver remains neutral to downward bias, at the brisk of accelerating its downtrend if sellers push prices below the above-mentioned trendline. Once done, the next demand area would be the November 13 swing low of $21.88, followed by the October 6 daily low of $20.69.
On the other hand, if XAG/USD stays above that trendline and reclaims the $23.00 figure, the first technical barrier would be the 50-day moving average (DMA) at $23.12. Additional key resistance levels lie ahead, like the 100-DMA at $23.20, followed by the 200-DMA at $23.51. Once surpassed, the $24.00 figure would be up for grabs.
XAG/USD Price Analysis – Daily Chart
(Click on image to enlarge)

XAG/USD Technical Levels
XAG/USD
| OVERVIEW | |
|---|---|
| Today last price | 22.74 |
| Today Daily Change | -0.10 |
| Today Daily Change % | -0.44 |
| Today daily open | 22.84 |
| TRENDS | |
|---|---|
| Daily SMA20 | 24.03 |
| Daily SMA50 | 23.11 |
| Daily SMA100 | 23.24 |
| Daily SMA200 | 23.5 |
| LEVELS | |
|---|---|
| Previous Daily High | 23.1 |
| Previous Daily Low | 22.72 |
| Previous Weekly High | 25.92 |
| Previous Weekly Low | 22.94 |
| Previous Monthly High | 25.27 |
| Previous Monthly Low | 21.88 |
| Daily Fibonacci 38.2% | 22.87 |
| Daily Fibonacci 61.8% | 22.96 |
| Daily Pivot Point S1 | 22.67 |
| Daily Pivot Point S2 | 22.51 |
| Daily Pivot Point S3 | 22.29 |
| Daily Pivot Point R1 | 23.05 |
| Daily Pivot Point R2 | 23.27 |
| Daily Pivot Point R3 | 23.43 |
More By This Author:
GBP/USD Remains Steady Around 1.2550 With All Eyes On US CPIGold Price Remains On The Defensive Ahead Of US CPI Data
EUR/USD Advances Towards 1.0800 With The US CPI Data On Focus
Disclosure: Information on this article contains forward-looking statements that involve risks and uncertainties. Markets and instruments profiled on this page are for informational purposes ...
more


