AUD/NZD Analysis: Plummets As Australian Inflation Jumps
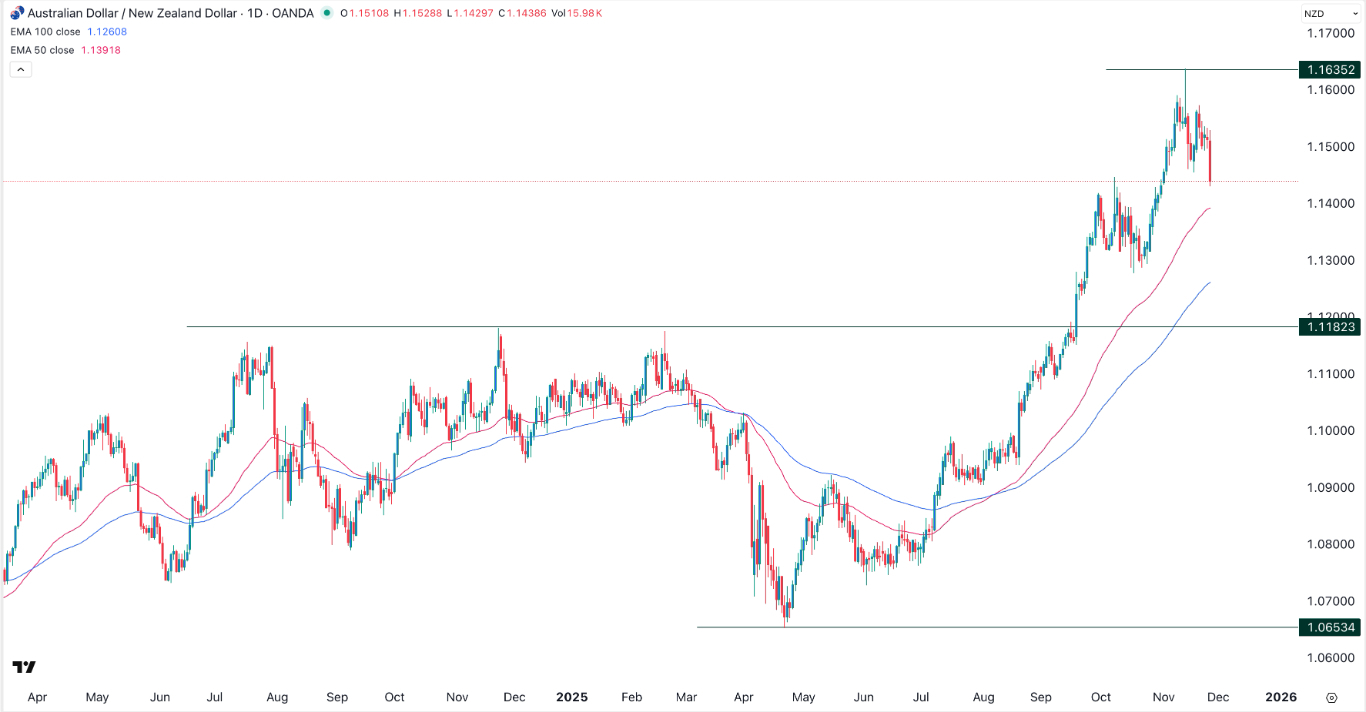
The AUD/NZD exchange rate pulled back after a report showed that Australia’s inflation continued rising in October. It dropped to 1.1455, its lowest level since November 4 this year. It has plunged by 1.60% from its highest point this year.
(Click on image to enlarge)

Australian Inflation Points to Hawkish RBA
The AUD/NZD exchange rate pulled back after Australia’s Bureau of Statistics (ABS) showed that inflation rose a bit in October. Data shows that the headline Consumer Price Index (CPI) rose from 3.6% in September to 3.8%, moving further away from the target of 2.0%.
The trimmed mean CPI rose from 3.2% in September to 3.3% in October, while the weighted inflation rose from 3.3% to 3.4%. This growth was driven by higher electricity prices in the country. These numbers mean that the Reserve Bank of Australia (RBA) will maintain interest rates steady in the upcoming meeting.
A report by CBA showed that the bank could return to interest rate hikes next year. The bank pointed to the elevated inflation rate, which has remained above the 2% target this year.
Meanwhile, the Reserve Bank of New Zealand (RBNZ) has maintained a dovish tone this year. It has slashed interest rates from 5.5% earlier this year to 2.25% as inflation has remained inside its 1-3% target range.
There will be no other major catalyst for the AUD/NZD this week as there will be no economic data from the two countries.
AUD/NZD Technical Analysis
The daily chart shows that the AUD/USD exchange rate has moved upwards in the past few months. It jumped from a low of 1.0653 in May to the year-to-date high of 1.1635.
The pair moved above the important resistance at 1.1182, its highest point in November last year and February this year. It has now lost the momentum, falling from the year-to-date high of 1.1635 to the current 1.1438.
This decline is partly because of the ongoing mean reversion, a situation where an asset moves back to its historical averages. It has also formed a small double-top pattern, a common bearish reversal sign.
Therefore, the most likely situation is where the pair drops to the 100-day moving average at 1.1260 in the coming months. A move above the resistance at 1.1500 will invalidate the bearish outlook.
More By This Author:
EUR/USD Forex Signal: Remains Below Supertrend As Fed Rate Cut Odds RiseEUR/USD Forex Signal: Supertrend Indicator Points To A Bearish Breakout
GBP/USD Forex Signal: Nears Bearish Breakout Ahead Of UK Budget
Risk Disclaimer: DailyForex will not be held liable for any loss or damage resulting from reliance on the information contained within this website including market news, analysis, trading signals ...
more


