
- AUD/JPY struggles to build on a two-day-old recovery momentum from a multi-month trough.
- BoJ rate hike bets and rising trade tensions benefit the safe-haven JPY and weigh on spot prices.
- The US-China trade war supports prospects for further losses amid a bearish technical setup.
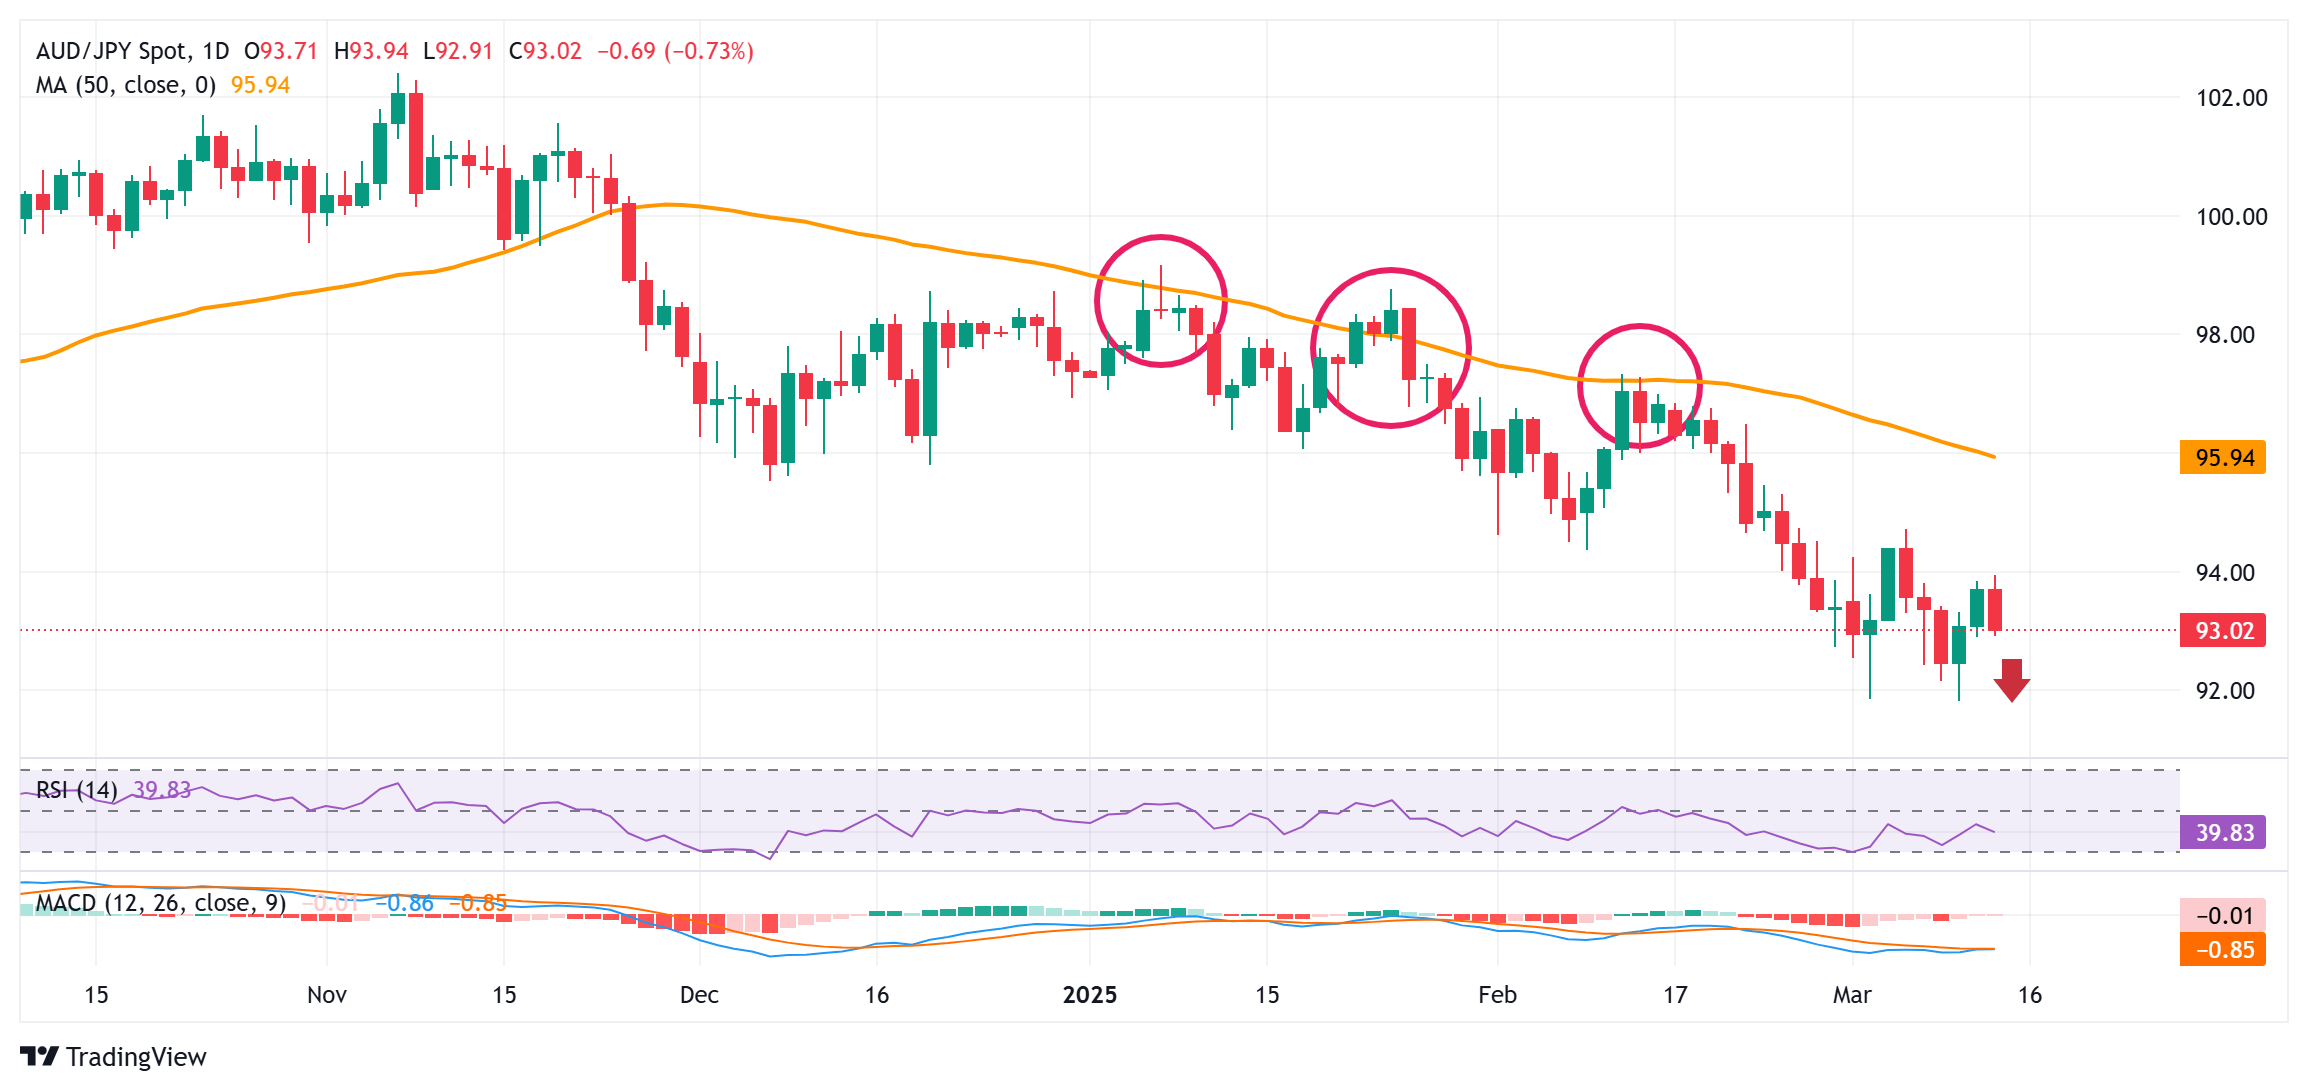
The AUD/JPY cross attracts fresh selling in the vicinity of the 94.00 mark, or the weekly top touched earlier this Thursday, and extends its steady intraday descent through the first half of the European session. Spot prices slide below the 93.00 mark in the last hour and for now, seem to have stalled a two-day-old recovery from the lowest level since August 2024 touched on Tuesday.
Against the backdrop of bets that the Bank of Japan (BoJ) will hike interest rates again, concerns about the potential economic fallout from US President Donald Trump's aggressive tariff policies boost demand for the safe-haven Japanese Yen (JPY). Apart from this, the risk of a further escalation of trade war between the US and China – the world's two largest economies – weighs on the Australian Dollar (AUD) and exerts additional pressure on the AUD/JPY cross.
From a technical perspective, the recent repeated failures near the 50-day Simple Moving Average (SMA) and bearish oscillators on the daily chart suggest that the path of least resistance for spot prices remains to the downside. Hence, some follow-through weakness towards the 93.50 intermediate support, en route to the 92.00 mark and the 91.80 area or a multi-month low, looks like a distinct possibility amid bets that the Reserve Bank of Australia (RBA) will cut rates further.
On the flip side, any meaningful recovery now seems to confront immediate resistance near the 93.70 region. This is followed by the weekly top, around the 94.00 mark, which if cleared decisively should pave the way for a further near-term appreciation. The AUD/JPY cross might then aim to surpass the monthly peak, around the 94.70-94.75 area, and reclaim the 95.00 psychological mark before climbing further towards the 96.00 neighborhood, or the 50-day SMA barrier.
The latter should act as a key pivotal point, which if cleared decisively might shift the near-term bias in favor of bullish traders and suggest that the AUD/JPY cross has formed a near-term bottom. This, in turn, would set the stage for a move towards the 96.65 intermediate resistance en route to the 97.00 round figure, the 97.75-97.80 region, and the 98.00 mark.
AUD/JPY daily chart
(Click on image to enlarge)
More By This Author:
Gold Price Holds Near Record High; Looks To US PPI For Some Meaningful ImpetusAUD/USD Gains After US CPI Data
EUR/USD Price Analysis: Consolidates Near 1.0900 As Bulls Take A Breather


Comments
Log in or sign up to join the conversation.