

Image Source: Unsplash
- The AUD/JPY stands strong at around 97.45, flaunting a gain of 0.25%.
- Despite the upwards movements, the cross will still close a 0.20% weekly loss.
- An optimistic scenario is reflected in larger time frames with the pair trading above the 20,100,200-day SMAs.
On Friday's session, the AUD/JPY was trading at 97.45, up by 0.25%. The daily chart shows a neutral to bullish sentiment, with bulls keenly holding their ground while the four-hour outlook mirrors the daily one, with a predominant bullish presence.
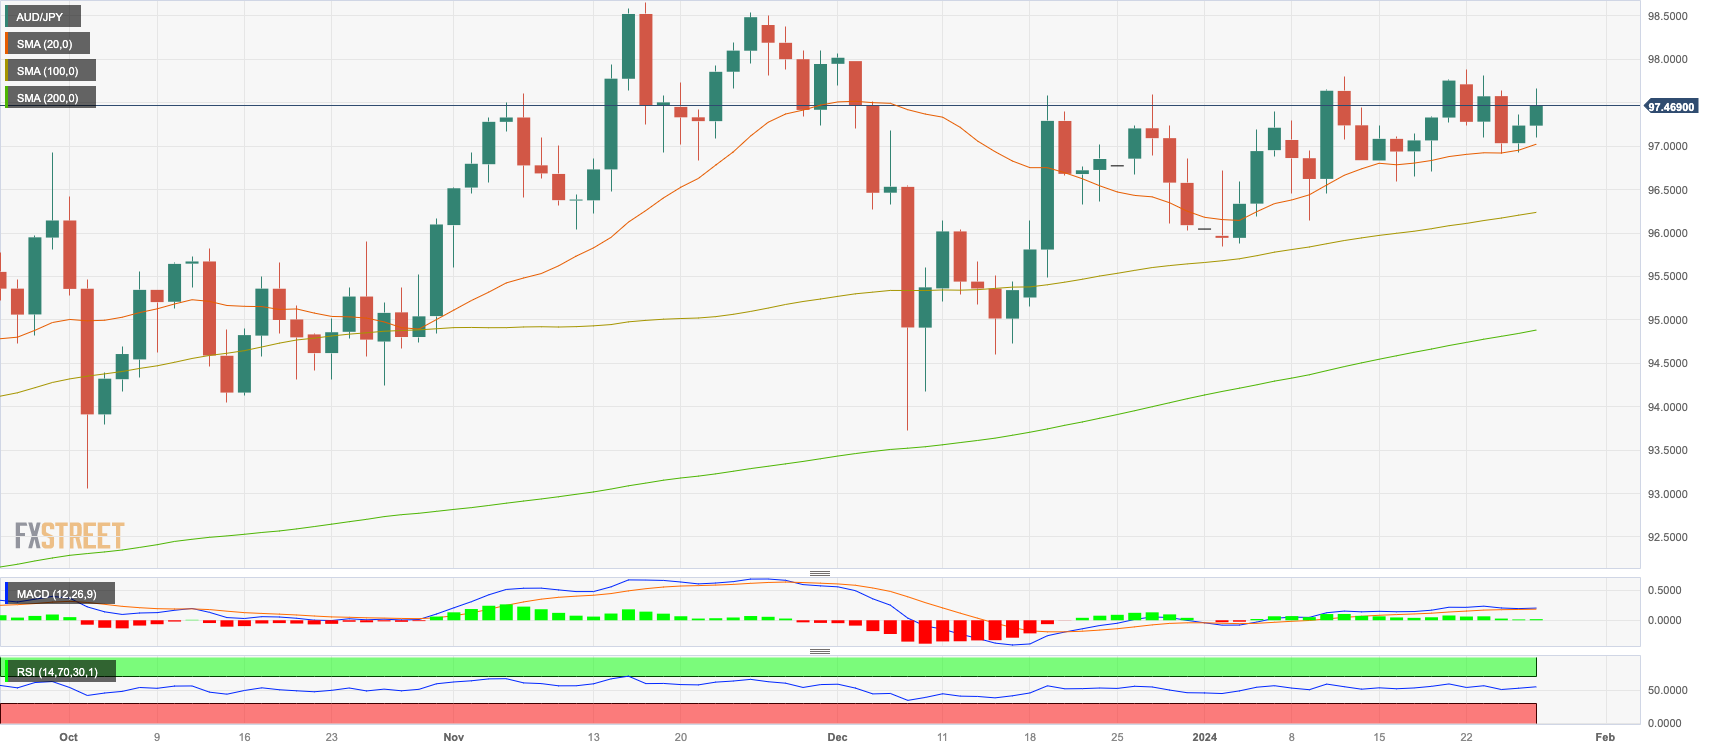
The indications on the daily chart reflect a sideway move with a slight bullish inclination. A surge is suggested by the Relative Strength Index (RSI) with a positive slope and lies in positive space, indicating that the buying strength still holds the upper hand. Yet, the Moving Average Convergence Divergence (MACD) showing static green bars suggests a lack of momentum for further bullish advancement. However, positioning above the 20, 100, and 200-day Simple Moving Averages (SMAs) solidifies the evidence that bulls dominate in the long-run realm, even with the weekly retracement.
The four-hour chart, it echoes a similar sentiment. The Relative Strength Index (RSI), still in positive territory and on an upward bend hints at the continued presence of bullish momentum. In the meanwhile, the Moving Average Convergence Divergence (MACD) laying flat with red bars could point to a short-term pullback or consolidation period. Nonetheless, the bulls' persistence indicates that the uptrend may continue in the following trading sessions, assuming that buying pressure remains.
AUD/JPY daily chart
AUD/JPY levels to watch
AUD/JPY
| OVERVIEW | |
|---|---|
| Today last price | 97.46 |
| Today Daily Change | 0.22 |
| Today Daily Change % | 0.23 |
| Today daily open | 97.24 |
| TRENDS | |
|---|---|
| Daily SMA20 | 96.95 |
| Daily SMA50 | 96.88 |
| Daily SMA100 | 96.21 |
| Daily SMA200 | 94.84 |
| LEVELS | |
|---|---|
| Previous Daily High | 97.36 |
| Previous Daily Low | 96.93 |
| Previous Weekly High | 97.76 |
| Previous Weekly Low | 96.59 |
| Previous Monthly High | 98.07 |
| Previous Monthly Low | 93.73 |
| Daily Fibonacci 38.2% | 97.2 |
| Daily Fibonacci 61.8% | 97.1 |
| Daily Pivot Point S1 | 96.99 |
| Daily Pivot Point S2 | 96.74 |
| Daily Pivot Point S3 | 96.56 |
| Daily Pivot Point R1 | 97.43 |
| Daily Pivot Point R2 | 97.61 |
| Daily Pivot Point R3 | 97.86 |
More By This Author:
Crude Oil Looks For The Ceiling As WTI Tests $78.00Pound Sterling Price News And Forecast: GBP Recovers On Improved Market Mood
GBP/JPY Lacks A Firm Intraday Direction, Manages To Hold Steady Above Mid-187.00s


Comments
Log in or sign up to join the conversation.