

Image Source: Unsplash
West Texas Intermediate (WTI) US Crude Oil bid into a two-month high north of 78$.00 per barrel on Friday as barrel traders pile into long bets on continuing geopolitical concerns and near-term supply constraints. Crude Oil prices have skewed to the high side this week after a dogpile into long trades leaves markets exposed to an exacerbated pullback if further net long positions can’t be pulled into the order books.
A cold snap in the US last week temporarily crimped supply lines, adding to a drawdown in US Crude Oil stocks according to reporting by the Energy Information Administration (EIA) this week. EIA barrel counts showed a 9.233 million barrel drawdown in the US for the week ended January 19, adding to the previous week’s drag of 2.492 million barrels. Despite another buildup in refined gasoline adding to already-burgeoning gasoline supplies, energy markets are broadly focusing on the potential for ongoing Crude Oil supply constraints.
Iran-backed Houthi rebels in Yemen launched a fresh attack against US and UK naval targets on Friday, exacerbating Crude Oil jitters despite no reports of significant damage. The Houthis continue to threaten civilian cargo ships bound for the Suez Canal, and nearly ten strikes by coalition naval forces within three weeks have yet to quell Houthi aggression.
According to reporting by Bloomberg, citing Dan Ghali of TD Securities, algorithmic trend followers have pivoted into net long positions with Crude Oil traders net long WTI by around 30%,
WTI Crude Oil Technical Outlook
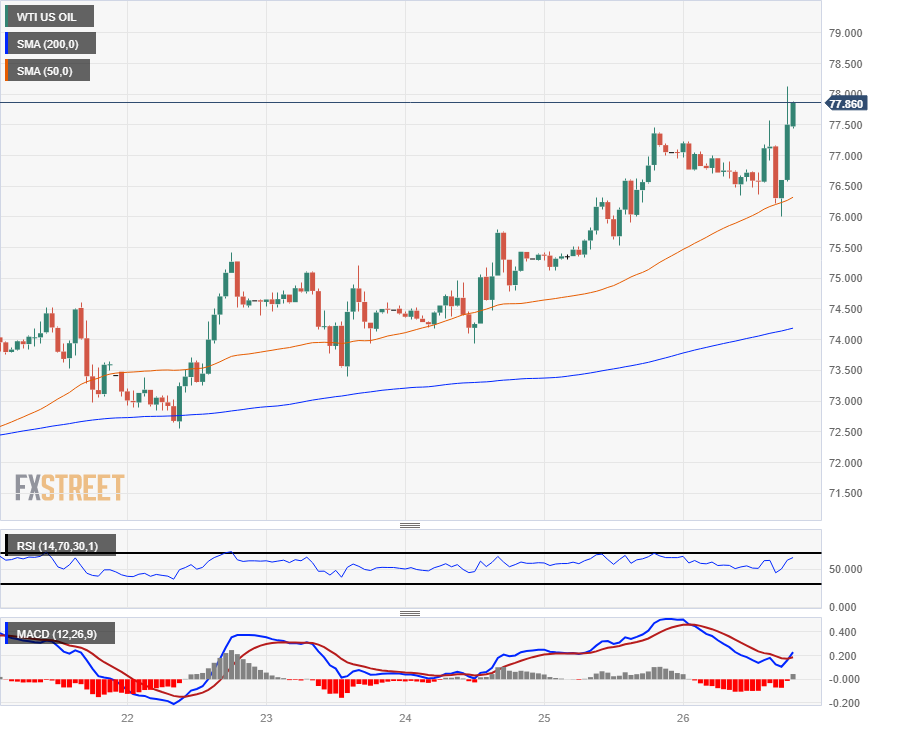
WTI caught an intraday rebound off the 50-hour Simple Moving Average (SMA) near $76.00 on Friday, and US Crude Oil is up nearly 2.5% on the day. The near-term technical floor is priced in at the 200-hour SMA just north of the $74.00 handle.
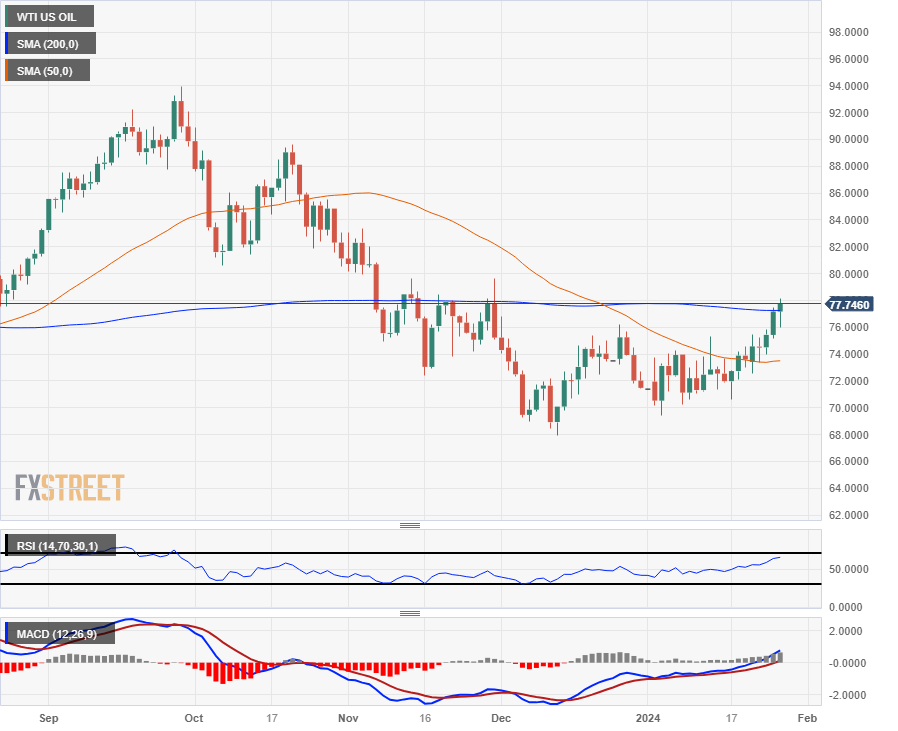
Daily candlesticks have WTI testing into the 200-day SMA near 77.25, with oil bids climbing and setting WTI on pace to close in the green for a sixth of the last eight trading session.
WTI Hourly Chart
(Click on image to enlarge)
WTI Daily Chart
(Click on image to enlarge)
WTI US OIL
| OVERVIEW | |
|---|---|
| Today last price | 77.51 |
| Today Daily Change | 0.34 |
| Today Daily Change % | 0.44 |
| Today daily open | 77.17 |
| TRENDS | |
|---|---|
| Daily SMA20 | 72.97 |
| Daily SMA50 | 73.47 |
| Daily SMA100 | 79.1 |
| Daily SMA200 | 77.26 |
| LEVELS | |
|---|---|
| Previous Daily High | 77.45 |
| Previous Daily Low | 75.13 |
| Previous Weekly High | 74.6 |
| Previous Weekly Low | 70.63 |
| Previous Monthly High | 76.79 |
| Previous Monthly Low | 67.97 |
| Daily Fibonacci 38.2% | 76.57 |
| Daily Fibonacci 61.8% | 76.02 |
| Daily Pivot Point S1 | 75.72 |
| Daily Pivot Point S2 | 74.26 |
| Daily Pivot Point S3 | 73.4 |
| Daily Pivot Point R1 | 78.04 |
| Daily Pivot Point R2 | 78.91 |
| Daily Pivot Point R3 | 80.36 |
More By This Author:
Pound Sterling Price News And Forecast: GBP Recovers On Improved Market Mood
GBP/JPY Lacks A Firm Intraday Direction, Manages To Hold Steady Above Mid-187.00s
Canadian Dollar Gains On Thursday’s Crude Oil Climb


Comments
Log in or sign up to join the conversation.