
- The AUD/JPY rose in Monday's session at 97.60 with a gain of 0.23%.
- Hourly chart shows RSI and MACD dip, highlighting short-term buyers' shift to consolidate gains.
- The overall trend still favors the bulls.
In Monday's session, the AUD/JPY is trading at 97.60, registering a gain of 0.23%. The pair has seen a recent push from the buyers, which made indicators reach overbought territory and now indicators are consolidating. The overall trend still favors the buyers as the pair is still above its main Simple Moving Averages (SMAs)
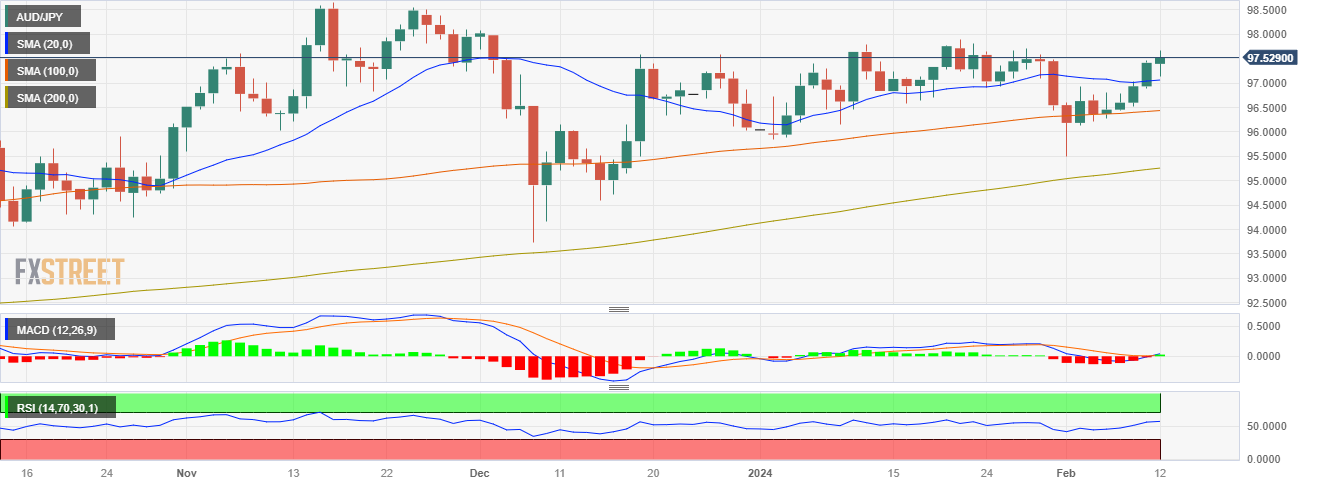
Analyzing the daily chart, the Relative Strength Index (RSI), which resides within the positive territory, continues to show an increasing trend, suggesting that buyers are currently exerting pressure on the market. This aligns with the Moving Average Convergence Divergence (MACD) histogram, which printed a green bar implying that the bulls jumped back a into positive territory.
Concentrating on the hourly chart, the RSI dipped back from the overbought area struck earlier in the session to the positive domain, hinting at a more balanced, albeit still buyers-favoured, market in recent hours. In line with that, the MACD histogram has been rising, throughout the session but now seems to have flattened as buyers are taking a breather.
Taking the pairs' position into account relative to its main Simple Moving Averages (SMAs), the broader trend is on the buyer's side, as the pair is above the 20, 100, and 200-day SMAs. Yet, for the rest of the session, the cross may continue side-ways trade to consolidate the gains from its recent push.
AUD/JPY daily chart
(Click on image to enlarge)
AUD/JPY
| OVERVIEW | |
|---|---|
| Today last price | 97.59 |
| Today Daily Change | 0.17 |
| Today Daily Change % | 0.17 |
| Today daily open | 97.42 |
| TRENDS | |
|---|---|
| Daily SMA20 | 97.04 |
| Daily SMA50 | 96.67 |
| Daily SMA100 | 96.42 |
| Daily SMA200 | 95.23 |
| LEVELS | |
|---|---|
| Previous Daily High | 97.46 |
| Previous Daily Low | 96.88 |
| Previous Weekly High | 97.46 |
| Previous Weekly Low | 96.22 |
| Previous Monthly High | 97.88 |
| Previous Monthly Low | 95.84 |
| Daily Fibonacci 38.2% | 97.24 |
| Daily Fibonacci 61.8% | 97.1 |
| Daily Pivot Point S1 | 97.04 |
| Daily Pivot Point S2 | 96.67 |
| Daily Pivot Point S3 | 96.46 |
| Daily Pivot Point R1 | 97.62 |
| Daily Pivot Point R2 | 97.83 |
| Daily Pivot Point R3 | 98.21 |
More By This Author:
EUR/GBP Edges Lower Ahead Of UK Economic DataUSD/CAD Price Analysis: Struggles For A Firm Intraday Direction, Remains Below 200-Day SMA
GBP/JPY Remains Tipped Into Bullish Side At The Tail End Of Another Tepid Week


Comments
Log in or sign up to join the conversation.