
Crypto Market Cap Struggles At Fibonacci Resistance Zone
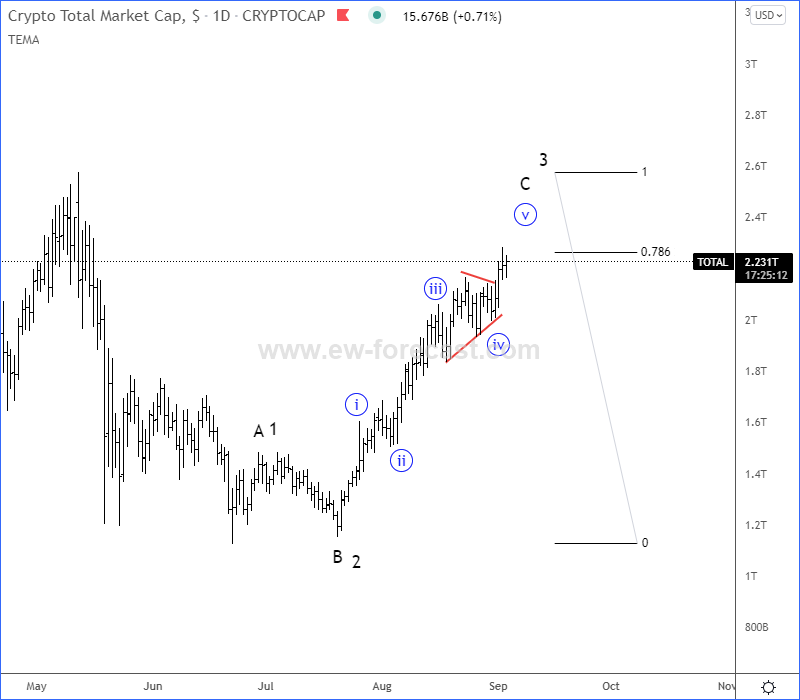
Crypto total market cap is trading at key do or die 78,6% Fibonacci resistance zone, but we see it trading in wave »v« of C/3, so the key will be an upcoming decline. Any sharp, strong, and impulsive decline back to 1.5T would be a signal for a completed wave C that can later send the price back to lows. However, if we get a slow, three-wave pullback only back to 2.0 - 1.8T, then we can expect a five-wave bullish impulse back to all-time highs.

Image Source: Pexels
As total crypto market cap trades at Fibonacci resistance, cryptocurrencies remain mostly under intraday bullish pressure and considering these bullish triangle patterns on BTC, LTC, and BCH seems like we will see more gains. However, watch out for limited rise once we see new intraday highs for the 5th waves, as ETH can be already trading at a strong resistance zone, so be also aware of spikes ahead of the weekend.
Crypto Market Total Market Cap Elliott Wave Analysis Chart
Disclosure: Please be informed that information we provide is NOT a trading recommendation or investment advice. All of our work is for educational purposes only.


Certainly a jargon-loaded rport based on an interesting analysis system/method. Interesting.