


Image Source: Pixabay
And the headline CPI was below. Here are price levels for several CPI components:
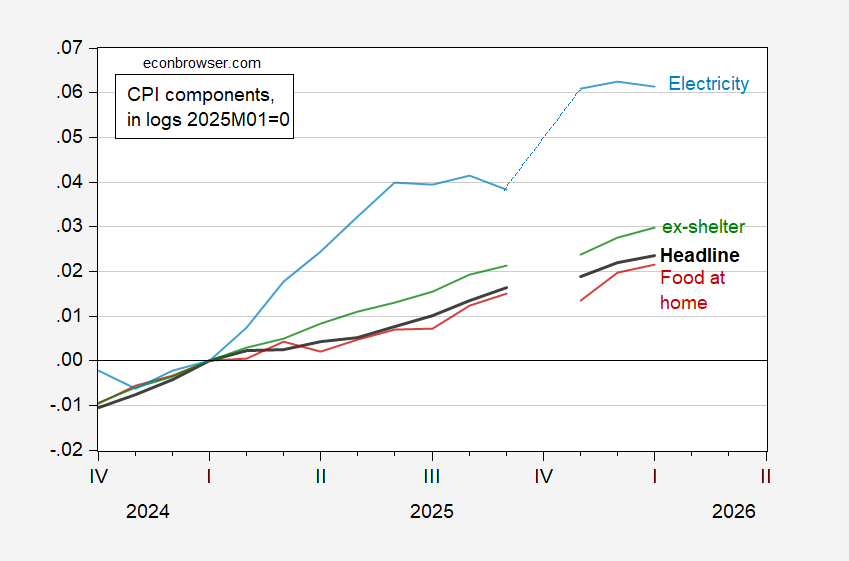
Figure 1: CPI (bold black), CPI food at home (red), CPI ex-shelter (green), CPI electricity (light blue), all s.a., in logs, 2025M01=0. Source: BLS, and author’s calculations.
Grocery prices keep on rising in January. Food price component and ERS forecasts:
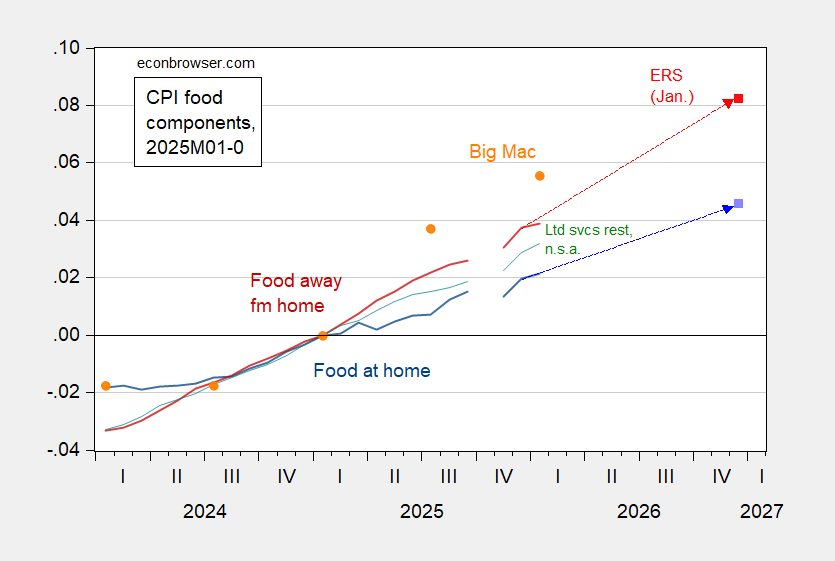
Figure 2: CPI – food at home (blue), ERS January forecast (light blue square), CPI – food away from home (dark red), ERS January forecast (red square), CPI – food away from home, limited services restaurants, n.s.a. (green), Big Mac price, n.s.a. (orange circle), all in logs 2025M01=0. Source: BLS via FRED, BLS, ERS, Economist, and author’s calculations.
Reported CPI food indices seem a little strange around October. The price index for food away from home has diverged from grocery prices; ERS forecasts December 2026 year-on-year inflation at 4.6%, up from 4.1% in 2025.
As a check on magnitudes, I plot Big Mac prices (in US$), sourced from the Economist. In January, they were up 5.5% relative to January 2025.
More By This Author:
Ten Days To 2025Q4 Advance Release: Nowcasts, Forecasts“Liberation Day” Interpreted Through The Lens Of The Benchmark Revision
A Levels Perspective On The Employment Situation Release


Comments
Log in or sign up to join the conversation.